Functional analysis and allocation is the step in systems engineering that turns a list of requirements into a structured description of what a system must do, how well each part of that job must be done, and where each piece of the job will eventually live. It sits between requirements analysis, which works out what stakeholders need, and design synthesis, which picks the hardware, software, people and facilities that will meet those needs. Wikipedia describes it as the step that "bridges the gap between requirements engineering and design", and that is a fair one-line summary.
The output is usually called a functional architecture (or, in newer vocabulary, a logical architecture). It is a description of the system expressed entirely in terms of functions, the flows between them, the order in which they happen, and the performance each one must reach. It deliberately says nothing yet about which physical component does the work. A good functional architecture lets engineers argue about the problem before they start arguing about the solution, and it gives every later design decision a traceable reason for existing.
This article explains where the activity came from, how it is done step by step, the main diagramming techniques (functional flow block diagrams, IDEF0, N2 charts, timeline analysis, requirements allocation sheets, FAST diagrams and SysML), how performance budgets are split, how the idea is used in human factors to decide what people and machines should each do, and where the method tends to go wrong.
What the activity is for
A requirement such as "transport a squad of troops 50 kilometres within 90 minutes while keeping in constant communication" says nothing about trucks, radios or drivers. Before anyone can pick those things, the team needs to know what actions the system has to carry out, in what order, under what conditions, and with what time, distance, accuracy or reliability budget for each action.
The US Defense Acquisition University (DAU) textbook Systems Engineering Fundamentals (2001) states the purpose plainly: to transform the functional, performance, interface and other requirements identified in requirements analysis "into a coherent description of system functions that can be used to guide the Design Synthesis activity that follows." It adds that the designer will need to know what the system must do, how well, and what constraints will limit design flexibility.
The NASA Systems Engineering Handbook (NASA/SP-2016-6105 Rev 2) calls the equivalent process "logical decomposition" and describes it as "the process for creating the detailed functional requirements" that let a project meet stakeholder expectations. NASA describes functional analysis as "the primary method used in system architecture development and functional requirement decomposition."
Three goals run through all the major sources:
| Goal | What it means in practice |
|---|---|
| Completeness | Every required action, including support, test, training and disposal, is identified before design starts |
| Allocation | Each top-level performance requirement is split into budgets for lower-level functions, so the parts add up to the whole |
| Traceability | Every lower-level function and requirement can be traced up to the stakeholder need that justified it, and down to the design element that satisfies it |
The DAU text sums up the attitude in one line: the objective is to identify the functional, performance and interface design requirements; "it is not to design a solution...yet!"
Where it sits in the systems engineering process
Classic US defence and aerospace systems engineering describes a loop of four activities: requirements analysis, functional analysis and allocation, design synthesis, and verification, all wrapped in systems analysis and control (trade studies, risk management, configuration management and so on). Functional analysis and allocation is the second box.
It is not done once. The DAU text describes it as "repeated to define successively lower-level functional and performance requirements, thus defining architectures at ever-increasing levels of detail." Each pass takes the functions and budgets from the level above and breaks them down one more level.
It is also not one-way. Two feedback loops matter:
- The requirements loop. While decomposing functions, engineers often discover that two requirements conflict, that a directed component or standard forces an awkward sequence, or that a requirement is missing. The DAU text says revisiting requirements analysis "will be necessary", most likely because of "a conflict caused by mutually incompatible requirements."
- The design loop. Once candidate physical designs exist, they may show that a particular functional breakdown is impractical, or that an off-the-shelf component already performs a bundle of functions in a different arrangement. The functional architecture is then adjusted.
The INCOSE Systems Engineering Body of Knowledge (SEBoK) makes the same point in its guidance on logical architecture: the static decomposition tree "is not created by a single top-down pass", and analysis and synthesis should alternate in small cycles.
| Process step | Main question | Typical output |
|---|---|---|
| Requirements analysis | What do stakeholders need, and under what constraints? | Validated requirements, measures of effectiveness, concept of operations |
| Functional analysis and allocation | What must the system do, in what order, and how well must each function perform? | Functional (logical) architecture, allocated and derived requirements |
| Design synthesis | What physical elements will perform those functions? | Physical architecture, specifications, drawings, code |
| Verification | Does the built system meet the requirements? | Test, analysis, inspection and demonstration results |
Key ideas and vocabulary
Functions
A function is a discrete action the system must perform. The DAU text insists functions be written with action verbs, and offers "a simple rule": look to see if all the functions are verbs; "if there is a function identified as a noun, then there is a problem with the understanding of the functions." "Navigation" is a noun and hides what is actually happening; "determine position", "compute route" and "display heading" are functions.
SEBoK gives a more formal definition: a function is an action that transforms inputs into outputs, where the inputs and outputs can be data, materials or energy. It writes this as y = f(x, t), stressing that a function's outputs depend on its inputs and on time.
Functions will eventually be performed by equipment, personnel, facilities, software or a combination of these. Keeping that question open at this stage is the whole point.
Functional decomposition
Decomposition breaks a top-level function into sub-functions, and those into sub-sub-functions, until each lowest-level function is small enough that a known or feasible physical solution can perform it. SEBoK describes breaking a complex function down "into sub-functions for which physical solutions are known or feasible." The result is a hierarchy, often numbered 1.0, 1.1, 1.1.1 and so on.
Allocation
Allocation means assigning requirements to functions. Performance allocation splits a top-level number (time, mass, power, error, reliability, cost) into budgets for each sub-function. Later, functional allocation in the design sense assigns each function to a physical element. In the narrow DAU sense, "allocation" in this step refers mainly to performance: "allocating performance from higher- to lower-level functions."
Functional architecture versus logical architecture
The DAU text defines the functional architecture as "a top-down decomposition of system functional and performance requirements" that shows not only the functions but "the logical sequencing of the functions and performance requirements associated with the functions." It is a description of the system "in terms of functions and performance parameters, rather than a physical description."
SEBoK uses "logical architecture" as the broader term. It describes a logical architecture model as "composed of a set of related technical concepts and principles that support the logical operation of the system", and divides it into three views:
| View | What it captures |
|---|---|
| Functional | The set of functions and sub-functions that "defines the transformations performed by the system to complete its mission" |
| Behavioural | How functions are sequenced and controlled: scenarios, operational modes, transitions, triggers |
| Temporal | How often functions run: synchronous (cyclic) functions versus asynchronous, event-driven ones |
Derived requirements
Requirements that did not exist in the original baseline but arise from the chosen architecture are called derived requirements. If a decision splits a function into "acquire signal" and "process signal", the interface between them now needs a requirement of its own. NASA notes that "both the baselined and derived requirements are allocated to the system architecture and functions."
Functional partitioning
Partitioning groups functions that logically belong together, usually to minimise the number of interfaces between groups. DAU describes it as grouping functions "that logically fit with the components likely to be used, and to minimize functional interfaces", noting that it supports modular components and open-system designs, and helps engineers understand how existing or commercial equipment will fit.
How the work is done, step by step
Different organisations list the activities differently, but the content is consistent. The DAU text lists the activities in its process diagram as: define system states and modes; define system functions and external interfaces; define functional interfaces; allocate performance requirements to functions; analyse performance; analyse timing and resources; analyse failure mode effects and criticality; define fault detection and recovery behaviour; and integrate functions.
NASA reduces functional analysis to three steps: translate top-level requirements into functions that must be performed; decompose and allocate those functions to lower levels of the product breakdown structure; and identify and describe functional and subsystem interfaces. NASA adds that each function is described "in terms of inputs, outputs, failure modes, consequence of failure, and interface requirements."
SEBoK's version is organised as five activities:
- Identify and analyse functional and behavioural elements: derive functions, flows, modes and scenarios from the system requirements, and define the inputs, outputs and controls each function needs.
- Assign system requirements to functional and behavioural elements: allocate performance, effectiveness and constraint requirements to functions and flows, and establish traceability.
- Define candidate logical architectures: integrate modes and scenarios into a behavioural model, add temporal constraints, run failure analysis, and simulate where possible.
- Synthesise the selected logical architecture: compare candidates against criteria, choose one using decision management, and capture the rationale.
- Feed back to requirements and the physical architecture: update derived requirements and baselines.
Putting these together, a practical sequence looks like this:
| Stage | What happens | Typical product |
|---|---|---|
| 1. Establish context | Define the system boundary, external actors, inputs and outputs | Context diagram, top-level N2 chart |
| 2. Define modes and scenarios | Work out operating states (start-up, normal, degraded, maintenance) and the operational scenarios from the concept of operations | Mode/state diagram, scenario list |
| 3. Identify top-level functions | Name the handful of actions that accomplish the mission | Top-level FFBD |
| 4. Decompose | Break each function down, level by level | Lower-level FFBDs, IDEF0 child diagrams |
| 5. Define interfaces | Identify every flow between functions and across the boundary | N2 charts, interface lists |
| 6. Allocate performance | Split top-level numbers into budgets | Requirements allocation sheets, budgets |
| 7. Analyse time and resources | Check that sequences fit time windows and resource limits | Timeline analysis sheets |
| 8. Analyse failure | Ask what happens when each function fails | Functional FMEA, fault detection and recovery functions |
| 9. Trade alternatives | Compare different decompositions | Trade study reports |
| 10. Baseline and trace | Freeze the agreed architecture and link it to requirements | Traceability matrix, functional specification |
NASA is clear about when to freeze: only once requirements are viable, verifiable and internally consistent. "Only at that point should the system architecture and requirements be baselined."
A worked example from the DAU textbook
The clearest published illustration is the Marine Corps example in Chapter 5 of Systems Engineering Fundamentals. The requirement is to transport troops in squad-level units over 50 kilometres, within 90 minutes of the transport system's arrival, with constant communication throughout.
The preliminary functional architecture has three levels:
- First level: "Perform mission" — the basic functional requirement.
- Second level: two parallel functions, "Transport" and "Communicate". The transport function inherits the mission's 50 km and 90 minute requirements.
- Third level: transport is decomposed into five sequential sub-functions: Load, Start, Move, Stop and Unload, each with an allocated time and distance.
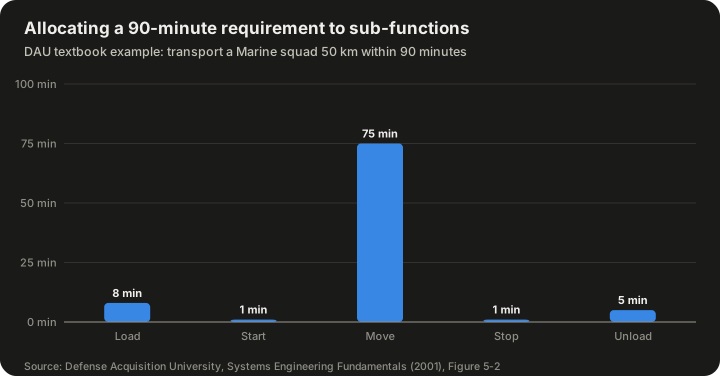
| Sub-function | Allocated time (min) | Allocated distance (km) |
|---|---|---|
| Load | 8 | 0 |
| Start | 1 | 0 |
| Move | 75 | 50 |
| Stop | 1 | 0 |
| Unload | 5 | 0 |
| Total | 90 | 50 |
Source: Defense Acquisition University, Systems Engineering Fundamentals (2001), Figure 5-2.
The arithmetic is simple but it shows the principle. The five time budgets add up to the 90 minute requirement (8 + 1 + 75 + 1 + 5 = 90), and the distance budgets add up to 50 km. The allocation also implies a derived requirement the original statement never mentioned: if the Move function gets 75 minutes for 50 km, the average speed while moving must be at least 50 ÷ (75/60) = 40 km/h. That number now constrains whatever vehicle the design team proposes, and it can be traced back to the mission requirement through the allocation.
The example also shows why allocation is a design choice. The team could have given loading 12 minutes and moving 71, which would demand an average of about 42.3 km/h (50 ÷ 71 × 60). Choosing between allocations is a trade: faster loading needs better doors, ramps or drill; faster moving needs a faster vehicle. Functional analysis makes the trade visible before money is spent.
Notice also that "Transport" and "Communicate" are drawn in parallel. That captures the requirement for constant communication: the communicate function must run for the entire duration of the transport function, not as a step before or after it.
The main tools and notations
The DAU text lists the "traditional tools" that structure the work: functional flow block diagrams, IDEF0 diagrams, timeline analyses and requirements allocation sheets, plus aids such as quality function deployment, N2 charts, data flow diagrams, state and mode diagrams and behaviour diagrams. It adds an important caveat: "use of the tools illustrated in this chapter is not mandatory, but the process they represent is."
| Tool | What it shows | Best for |
|---|---|---|
| Functional flow block diagram (FFBD) | Sequence of functions, with AND/OR branching | Mission and operational sequences |
| IDEF0 | Each function's inputs, controls, outputs and mechanisms | Process and information flows |
| N2 chart | Interfaces between every pair of functions or elements | Interface identification and partitioning |
| Timeline analysis sheet (TLS) | Duration, overlap and concurrency of time-critical functions | Time budgets and schedules |
| Requirements allocation sheet (RAS) | Link between each function, its performance requirements and the physical element | Traceability into design |
| FAST diagram | How and why each function exists, from value engineering | Cost reduction and redesign |
| Use case analysis | Interactions between users and the system | Software-intensive systems |
| SysML activity, state machine and sequence diagrams | Functional, behavioural and temporal views in one model | Model-based systems engineering |
Functional flow block diagrams
The FFBD is the workhorse of classic functional analysis. The DAU text states its purpose as "to describe system requirements in functional terms." It is structured to ensure that all life-cycle functions are covered, all elements of the system (prime equipment, training, spare parts, data, software and so on) are identified, support requirements are tied to specific functions, and the proper sequencing of activities is established.
DAU lists the conventions:
| FFBD element | Convention |
|---|---|
| Function block | One solid box per function, each a "definite, finite, discrete action" |
| Numbering | Consistent decimal scheme: 1.0, 2.0 at top level; 1.1, 1.2 at the next; 1.1.1 below that |
| Functional reference | A bracketed box referring to a function on another diagram |
| Flow connection | Lines show functional flow only, not elapsed time or hidden activity |
| Flow direction | Generally left to right |
| Summing gates | A circle marked AND (parallel functions, all must complete) or OR (alternative paths) |
| Go / no-go | "G" and "bar G" mark alternative paths after a decision |
The numbering scheme is more than tidiness. DAU notes that function numbers "establish identification and relationships that will carry through all Functional Analysis and Allocation activities and facilitate traceability from lower to top levels." The same numbers appear on timeline sheets and requirements allocation sheets, which is how an engineer can follow one function across every document.
FFBDs are "functionally oriented — not solution oriented." The boxes say what happens, not which device does it. SEBoK also refers to enhanced FFBDs (eFFBDs), which add data and item flows to the control flow.
IDEF0
IDEF0 (Integration Definition for Function Modelling) comes from the US Air Force's Integrated Computer-Aided Manufacturing programme. It was published as US Federal Information Processing Standard 183 (FIPS 183), with the companion data-modelling standard IDEF1X as FIPS 184, both maintained by the National Institute of Standards and Technology according to the DAU text.
Where an FFBD shows sequence, IDEF0 shows what each function needs. Every function is a box, and the side an arrow touches tells you its role:
| Arrow position | Role |
|---|---|
| Left | Inputs: the data or objects the function transforms |
| Top | Controls: rules, standards, plans that govern the function |
| Right | Outputs: what the function produces |
| Bottom | Mechanisms: people, tools or systems that perform the function |
An IDEF0 model starts with a single top-level context diagram (called A-0) that sets the scope and viewpoint, and is then decomposed into "child" diagrams. DAU describes it as useful for "data flow, system control, and the functional flow of life cycle processes", and notes it can represent "a wide variety of business, manufacturing and other types of enterprise operations to any level of detail."
The bottom arrow is where IDEF0 touches allocation directly: the mechanism is the thing that will perform the function, so filling it in is, in effect, allocating the function.
N2 charts
The N2 chart (pronounced "N-squared") was invented by systems engineer Robert J. Lano at TRW and first published in a 1977 TRW report. It is a square matrix. The N functions or elements sit on the diagonal; the off-diagonal cells record the interfaces between them. By convention, outputs travel horizontally and inputs vertically, so a mark in row A, column B means A sends something to B. A blank cell means no interface.
N2 charts are good at three things:
- Finding missing interfaces. Every pair is checked explicitly, so a forgotten connection shows up as a blank that should not be blank.
- Partitioning. Re-ordering the rows and columns to cluster marks near the diagonal reveals natural groupings of tightly connected functions, which can then be packaged together to minimise external interfaces.
- Spotting feedback. Marks below the diagonal (with the usual ordering) indicate feedback loops, which often signal timing or stability concerns.
The NASA Systems Engineering Handbook (1995 edition) covered N2 diagrams in an appendix alongside FFBDs and timeline analysis, and Wikipedia notes the chart should be used at each successively lower level of decomposition.
Timeline analysis sheets
The timeline analysis sheet "adds detail to defining durations of various functions", in the DAU text's words. It shows concurrency, overlap and sequence, and it identifies time-critical functions that directly affect system availability, operating time and maintenance downtime.
DAU's example is a launch vehicle: Function 3.1, "Establish and maintain vehicle readiness from 35 hrs to 2 hrs prior to launch." Its sub-functions are drawn as bars on a time axis, with durations labelled.
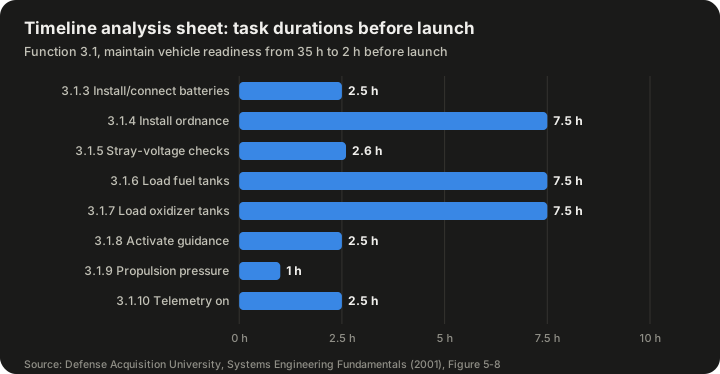
| Function | Duration (h) |
|---|---|
| 3.1.3 Install and connect batteries | 2.5 |
| 3.1.4 Install ordnance | 7.5 |
| 3.1.5 Perform stray voltage checks and connect ordnance | 2.6 |
| 3.1.6 Load fuel tanks | 7.5 |
| 3.1.7 Load oxidizer tanks | 7.5 |
| 3.1.8 Activate guidance system | 2.5 |
| 3.1.9 Establish propulsion flight pressure | 1.0 |
| 3.1.10 Telemetry system "on" | 2.5 |
Source: Defense Acquisition University, Systems Engineering Fundamentals (2001), Figure 5-8. Functions 3.1.1 (ground power) and 3.1.2 (vehicle air conditioning) run continuously across the window and have no separate duration.
The listed durations add up to 33.6 hours, but the window from 35 hours to 2 hours before launch is only 33 hours long. That is only possible because some tasks overlap, which is exactly what a timeline sheet is for: it shows which tasks must run in parallel and which must wait. In a real programme the sheet would be the place where someone notices that two 7.5-hour propellant-loading tasks cannot share the same crew or the same pad equipment at the same time.
Requirements allocation sheets
The requirements allocation sheet (RAS) "documents the connection between allocated functions, allocated performance and the physical system", according to DAU. It provides traceability between functional analysis and design synthesis and shows any disconnects. DAU calls it "a major tool in maintaining consistency between functional architectures and designs that are based on them."
A typical RAS row holds the function number and name, the functional performance and design requirements, any facility requirements, and the nomenclature and specification number of the equipment item that will perform it. The DAU example, for function 2.58.4 "Provide guidance compartment cooling", allocates requirements such as maintaining the compartment within 0.2 °F of its initial calibration temperature (which itself lies between 66.5 and 68.5 °F) and providing storage for 65 gallons of chilled deionised-water coolant held between 40 and 50 °F and free of particles of 0.5 micron.
That example shows what allocated requirements should look like: specific, measurable, and tied to one function.
FAST diagrams
The Function Analysis System Technique (FAST) comes from value engineering rather than defence systems engineering. It is credited to Charles W. Bytheway of Sperry Rand's Univac division, who presented it to the Society of American Value Engineers in 1965 (some sources date its development to 1964). Wikipedia lists it as one of the methods of functional analysis and allocation.
A FAST diagram arranges functions, each written as an active verb plus a measurable noun, along a horizontal "critical path". Reading right to left answers how a function is achieved; reading left to right answers why it is needed. Functions that happen at the same time as, or are caused by, a function on the path are placed above or below it (the "when" direction). Scope lines mark the boundary of the problem being studied.
FAST is useful because it forces teams to challenge functions that exist only because of the current design. If a function cannot answer "why?" with another function on the path, it may be unnecessary — and in value engineering, unnecessary functions are unnecessary costs.
Use case analysis
For software-intensive systems, use cases describe sequences of interactions between an external actor and the system to achieve a goal. Wikipedia cites a 2015 systematic literature review by Saurabh Tiwari and Atul Gupta in Information and Software Technology on use case specification research. Use cases are good at capturing what users need and in what order, which feeds directly into functional decomposition.
SysML and model-based systems engineering
In model-based systems engineering (MBSE), the separate drawings above are replaced by a single model in which each function, flow and requirement is an object that can be linked, queried and checked. The Object Management Group's Systems Modeling Language (SysML) is the most common language; Wikipedia cites SysML v1.6 (2019). SysML activity diagrams play the role of FFBDs, state machine diagrams capture modes, sequence diagrams capture scenarios, and allocation relationships formally link activities to the blocks that perform them.
OMG approved SysML version 2.0 for final adoption in 2025, announcing it in a press release dated 21 July 2025 together with the Kernel Modeling Language (KerML) 1.0 and a Systems Modeling API and Services specification. SysML v2 has its own textual notation as well as graphical views, which makes models easier to compare and version-control.
The advantage of a model over a stack of drawings is consistency: if a function is renamed or deleted, every diagram and trace link updates together. The cost is tool expertise and the discipline to keep the model as the single source of truth.
Allocating performance: budgets and margins
Performance allocation is where functional analysis turns quantitative. Common budgets include:
| Budget | Top-level requirement example | Allocated to |
|---|---|---|
| Time | End-to-end response within a deadline | Each step in the processing chain |
| Mass | Total vehicle mass limit | Each subsystem |
| Power | Total power available | Each function or equipment item |
| Error | Overall pointing or positioning accuracy | Each error source (sensor, actuator, structure, software) |
| Reliability | Probability of mission success | Each function in series or parallel |
| Data | Bandwidth or storage limit | Each data-producing function |
Two arithmetic patterns appear again and again.
Additive budgets. Time, mass and power usually add up directly. If a response must happen within 2.0 seconds and there are four sequential steps, their allocations must sum to no more than 2.0 seconds, ideally with a margin held back at system level. The DAU transport example is an additive budget.
Multiplicative budgets. For functions in series, where every function must work for the mission to succeed, reliabilities multiply. As a hypothetical illustration: if a system-level requirement is 0.95 probability of success and there are three series functions given equal shares, each needs a reliability of 0.95^(1/3), which is about 0.983. Check: 0.983 × 0.983 × 0.983 ≈ 0.950. Equal sharing is rarely sensible in practice — a mature function might easily achieve 0.995 while a novel one struggles to reach 0.97 — so budgets are usually negotiated, not divided evenly. With those two figures, the third function would need at least 0.95 ÷ (0.995 × 0.97) ≈ 0.984.
Independent random errors are usually combined as a root sum of squares rather than added. As a hypothetical example, three independent error sources of 3, 4 and 12 units combine to √(9 + 16 + 144) = √169 = 13 units, not 19. This matters in allocation: it means the largest single contributor dominates, so effort is best spent reducing it.
Whatever the pattern, good practice is to hold some margin at each level rather than allocating 100 per cent of the requirement immediately. The margin absorbs the growth that almost always happens as designs mature.
Allocating functions between people and machines
The phrase "function allocation" has a second, closely related meaning in human factors engineering: deciding which functions should be performed by human operators and which by automation. This is the point at which functional analysis meets questions of workload, trust and safety, and it is one of the most heavily studied parts of the subject.
The Fitts list
The classic starting point is a 1951 report edited by psychologist Paul Fitts, Human Engineering for an Effective Air-Navigation and Traffic-Control System, prepared for the US Air Navigation Development Board under the National Research Council's Committee on Aviation Psychology. It contained a short list of statements about what humans do better than machines and what machines do better than humans. This became known as the Fitts list, or informally "MABA-MABA" (men are better at, machines are better at).
In paraphrase, the list credits people with things such as detecting small amounts of visual or acoustic energy, perceiving patterns, improvising and using flexible procedures, storing large amounts of information for long periods and recalling relevant facts at the right time, reasoning inductively, and exercising judgement. It credits machines with responding quickly to control signals, applying great force smoothly and precisely, performing repetitive routine tasks, storing information briefly and erasing it completely, reasoning deductively, and handling highly complex operations by doing many different things at once.
Criticism and persistence
The Fitts list has been criticised for decades. Critics argue that it treats humans and machines as interchangeable components to be compared on a single scale, that it ignores the way automation changes the human's job rather than simply removing tasks from it, and that machine capabilities have long since overtaken many of the list's assumptions.
Even so, J. C. F. de Winter and D. Dodou, in a 2014 paper in Cognition, Technology & Work titled "Why the Fitts list has persisted throughout the history of function allocation", argued that the list deserves more credit than it gets. They treated it as a scientific theory rather than a design recipe and evaluated it against philosophy-of-science criteria, concluding that it is an adequate approximation of the most important regularity of automation. They also noted that, like many classics, the list is far more often cited than read.
Why this matters for systems engineers
The practical lesson is that the human operator is part of the functional architecture. When a function is allocated to a person, it generates derived requirements for displays, controls, training, procedures and workload. When it is allocated to automation, it generates requirements for monitoring, fault detection and hand-back to the operator. Either way, the allocation has to be analysed at the functional level, with timelines and failure analysis, before the hardware is chosen.
Outputs and how they feed later work
According to Wikipedia, the process produces a functional specification. In fuller form, the outputs include:
| Output | Used by |
|---|---|
| Functional (logical) architecture: decomposition, flows, sequences, modes | Design synthesis, to generate physical options |
| Allocated requirements for each function | Specification writers, subsystem teams |
| Derived requirements, including interface requirements | Requirements baseline, interface control documents |
| Timelines and budgets with margins | Design, verification planning |
| Failure modes and fault detection and recovery functions | Safety and reliability analysis |
| Traceability matrix linking needs, functions and requirements | Verification, change impact analysis |
| Rationale for the chosen decomposition | Future changes and reviews |
DAU describes the functional architecture as the full package: "the functional flow block diagrams, timeline sheets, requirements allocation sheets, IDEF0 diagrams, and all other documentation developed to describe the functional characteristics of the system."
Traceability is the output with the longest life. When a requirement changes years later, the trace links show which functions, allocated budgets and design elements are affected. That makes functional analysis the foundation of later change impact analysis and configuration management.
Why doing it early pays off
The argument for investing in functional analysis is that decisions made early lock in most of what a system will cost and how well it will perform, while changes made late are expensive. Systems engineering texts commonly illustrate this with a "committed life-cycle cost" curve. The INCOSE Systems Engineering Handbook reproduces a version credited to a 1993 Defense Acquisition University document, and a DAU Defense AT&L article states that decisions made by Milestone B commit roughly 70 per cent of a system's life-cycle cost while actual spending is still small. The exact percentages are disputed and should be treated as illustrative, but the direction is not: an omitted function or a bad allocation discovered during integration testing is far harder to fix than one caught on a whiteboard.
Functional analysis also manages complexity. Wikipedia notes the step is critical for handling the complexity of multidisciplinary systems. A spacecraft or a rail signalling system involves structures, electronics, software, thermal control, human operators and maintenance crews; a function-first description is the one place where all of them can see the same picture.
Good practice
The major sources agree on a set of habits:
- Start from scenarios, not from a tree. SEBoK recommends modelling system behaviour and scenarios before building the function decomposition tree. A static tree answers "what are the parts of the job?" but not "how does the system behave over time?"
- Use verbs. If a box contains a noun, the function is probably a hidden design decision.
- Always record inputs and outputs. SEBoK lists modelling functions without their inputs and outputs, or adding them too late, as a common mistake. NASA requires each function to be described in terms of inputs, outputs and failure modes.
- Cover the whole life cycle. The DAU text calls for examining all life-cycle functions, including what it calls the eight primary functions (in DAU usage: development, manufacturing, verification, deployment, operations, support, training and disposal), not just mission operations.
- Expect more than one valid decomposition. NASA notes that "there will almost certainly be alternative ways to decompose functions", giving the example that crew communications could be broken down by radio frequency, laser or internet. Treat the choice as a trade study.
- Alternate analysis and synthesis. SEBoK recommends small cycles of decomposition followed by grouping, rather than one huge top-down pass.
- Stop at the right depth. Decompose until each function can be allocated to one physical element, and no further. Over-decomposition is one of SEBoK's listed pitfalls.
- Keep management and operational functions apart. SEBoK warns against mixing governance, management and operational functions in the same view.
- Baseline only when consistent. NASA's advice is to baseline once requirements are viable, verifiable and internally consistent, and to remain open to revising earlier decisions.
- Capture rationale. NASA's process includes capturing decisions, assumptions and lessons learned as work products. Without rationale, later engineers cannot tell which allocations were deliberate and which were accidents.
Common pitfalls
| Pitfall | Why it hurts | Remedy |
|---|---|---|
| Jumping to hardware | Functions get named after components ("radio subsystem"), hiding alternatives | Write verb-noun functions; postpone allocation to physical items |
| Losing sight of requirements | SEBoK notes architects may invent solutions from their own assumptions | Trace every function to a requirement or scenario |
| Static decomposition only | The tree misses sequencing, modes and timing | Add FFBDs or activity diagrams, mode diagrams and timelines |
| Too deep, too soon | Thousands of functions bury the important ones | Decompose only to the level needed for allocation |
| Ignoring failure behaviour | Systems are designed only for the nominal case | Include fault detection, isolation and recovery functions |
| Missing life-cycle functions | Test, maintenance, training and disposal get bolted on later | Check against a life-cycle function list |
| No margins | Budgets break as soon as designs mature | Hold explicit margins at each level |
| Diagrams drift apart | FFBDs, N2 charts and allocation sheets contradict each other | Use common numbering or a single model |
Applications beyond defence and aerospace
Functional analysis and allocation grew up in military and space programmes, but the same reasoning appears in many fields:
- Automotive engineering. Driver-assistance and automated driving functions are decomposed into perception, planning and actuation, and each is allocated to sensors, processors and the human driver, with safety requirements allocated alongside.
- Medical devices. Functions such as "deliver dose" are decomposed and allocated so that hazards can be traced to specific functions and mitigations.
- Rail and air traffic control. These are classic sites for human–machine function allocation, the very problem Fitts's 1951 report addressed.
- Software architecture. Use cases, data flow diagrams and service decomposition apply the same logic to code.
- Business process design. IDEF0 was explicitly designed to model enterprise and manufacturing processes as well as technical systems.
- Value engineering. FAST diagrams are used to reduce cost by finding functions that do not need to exist.
Misconceptions
"Functional analysis is just drawing diagrams." The diagrams are aids. DAU's point that the tools are optional but the process is not is worth repeating: what matters is that sequences, interfaces, budgets and traces are worked out.
"It is a one-time, top-down activity." Every major source describes it as iterative and recursive, with feedback to requirements and from design.
"The functional architecture is the design." It is not. It describes what the system must do. Several quite different physical designs can satisfy the same functional architecture, which is precisely why it is useful for trade studies.
"Allocation means dividing numbers evenly." Budgets are negotiated according to difficulty, maturity and risk, and margins are held back.
"MBSE replaces functional analysis." Model-based approaches change the medium, not the thinking. SysML activity diagrams, state machines and allocation relationships are functional analysis expressed in a model.
"Function allocation between humans and machines is solved by a list." The Fitts list is a starting point, not a decision procedure. Allocation decisions must consider workload, situation awareness, failure recovery and how the operator's job changes when automation is added.
Frequently asked questions
What is the difference between functional analysis and functional decomposition? Functional decomposition is one part of functional analysis: breaking functions into sub-functions. Functional analysis also covers sequencing, interfaces, modes, timing, failure behaviour and performance allocation.
Is "logical decomposition" the same thing? Broadly, yes. NASA uses "logical decomposition" for the process that creates detailed functional requirements using functional analysis. SEBoK uses "logical architecture" for the result, with functional, behavioural and temporal views.
When is functional analysis "finished"? At each level, when every function is described with its inputs, outputs and allocated performance; every interface is identified; timing and resource checks pass; and the result is consistent with the requirements and can be allocated to physical elements. The process then repeats at the next level down.
Which tool should I use? Use whatever your organisation and contract require, but make sure the work covers sequence (FFBD or activity diagram), interfaces (N2 chart or interface model), timing (timeline), and allocation and traceability (RAS or model relationships).
How does it relate to verification? Allocated requirements become verification criteria. DAU notes that requirements are allocated and defined "in sufficient detail to provide design and verification criteria." Every allocated budget should have a planned test, analysis, inspection or demonstration.
Does it apply to agile software projects? The same questions apply — what must the system do, in what order, how well, and with which interfaces — even if the answers are captured incrementally in user stories, use cases and architecture decision records rather than in a single upfront document.
What is a "derived requirement" in plain terms? A requirement that nobody asked for directly, but that becomes necessary because of how the job was broken down. In the DAU example, "move at an average of at least 40 km/h" is derived from allocating 75 of the 90 minutes to moving 50 km.
Summary
Functional analysis and allocation is the disciplined habit of describing a system as a set of actions before deciding what will carry them out. It decomposes the mission into functions written as verbs, arranges them in sequences and modes, identifies every interface, splits each performance requirement into budgets, checks timing and failure behaviour, and records traceable links from stakeholder needs to design elements. Its tools — FFBDs, IDEF0, N2 charts, timeline sheets, requirements allocation sheets, FAST diagrams, use cases and SysML models — are means to that end. Done well, it gives design teams a clear, testable target and gives future engineers a map of why the system is the way it is.
Sources
- Functional analysis and allocation — Wikipedia
- Defense Acquisition University, Systems Engineering Fundamentals (2001), Chapter 5: Functional Analysis and Allocation (METU OCW copy)
- Defense Acquisition University, Systems Engineering Fundamentals (2001), full text via DTIC
- NASA Systems Engineering Handbook, Section 4.3: Logical Decomposition
- NASA Systems Engineering Handbook, NASA/SP-2016-6105 Rev 2 (NTRS)
- SEBoK: Logical Architecture
- SEBoK glossary: Functional Architecture)
- N2 chart — Wikipedia
- OMG Systems Modeling Language (SysML) v1.6
- OMG press release on SysML v2 adoption, 21 July 2025
- SysML v2 release repository
- de Winter and Dodou (2014), Why the Fitts list has persisted throughout the history of function allocation, Cognition, Technology & Work
- Fitts (ed.) (1951), Human engineering for an effective air-navigation and traffic-control system (HathiTrust record)
- Tiwari and Gupta (2015), A systematic literature review of use case specifications research, Information and Software Technology
- FAST Diagrams: The Foundation for Creating Effective Function Models (TRIZCON 2011)