
New collector designs improve laboratory performance, but useful fog harvesting depends on location, drainage, storage, maintenance, and an honest definition of yield.
A fog collector can look almost disappointingly simple: mesh stretched across a frame, a gutter beneath it, and a pipe leading away. The interesting engineering begins when someone asks what the pipe actually delivers. A photograph of glistening droplets proves that a surface is wet. It does not establish how much water reaches storage, how often that happens, or whether the collected water is suitable for its intended use. Those are separate measurements, with separate opportunities for disappointment and improvement.
A June 2025 experiment by Sina Nikbakht and Mohammad Mahdi Heyhat offers a concrete example of progress at the collector itself. They tested folded metal meshes under controlled conditions, comparing several fold angles and two flow velocities. The highest observed collection efficiency was 19.6 percent, more than twice that of the corresponding flat mesh comparison. The result concerns a laboratory configuration and its specified incoming fog, rather than a guaranteed yield on a mountain. Original experiment.
That distinction gives the field its central question. How does an improved interception surface become a dependable service? The answer runs from airborne droplets through a structure and into a storage system, then onward to the people or plants that need the water. Better materials can help along that route. They cannot determine when fog arrives, settle responsibility for repairs, or make a poorly monitored tank safe simply by producing a larger number in a laboratory test.
This article examines seven distinct primary studies, including two author-posted abstracts whose limits are stated where used. It separates measured laboratory performance, field observations, modeled resource potential, and original illustrative calculations. The evidence was checked on November 1, 2026; the dated experiments are not presented as discoveries made that day. The purpose is to explain the engineering and the evidence, not to offer a drinking-water treatment recipe or a site-specific construction design.
Start with a boundary, not a superlative
When a new collector is called more efficient, the first useful question is what crossed the boundary of the measurement. Water striking a fiber, water leaving a gutter, and water reaching a household are all plausible outputs. They are not interchangeable. An experiment can measure one very well while leaving the others outside its scope. A report that identifies its boundary is more informative than a report that merely selects the largest percentage available.
Consider an imaginary trial in which ten liters of liquid droplets pass through a defined reference plane during a test. Two liters arrive in the collection vessel. On that definition, collection efficiency is twenty percent. If a modified collector delivers three liters under the same reference conditions, its efficiency is thirty percent and its relative improvement is fifty percent. It has not become fifty percent efficient. Nor has it collected fifty additional percentage points of the incoming water. The arithmetic is elementary; the wording often is not.
This example also shows why relative gains depend on the baseline. Improving from one liter to two is a doubling. Improving from four liters to five adds the same absolute volume but produces a smaller relative gain. Neither comparison tells us which device gives the most useful water over a year. A modest improvement to a reliable, inexpensive system may matter more than a dramatic percentage gain measured against a deliberately weak reference. Conversely, an initially inefficient collector might offer unusually valuable room for improvement.
A responsible comparison therefore carries at least three pieces of information together: the actual output, the conditions under which it was measured, and the baseline used for the comparison. Removing any one can alter the impression without changing the numbers. A procurement discussion should be able to reconstruct the comparison from those pieces rather than relying on a promotional adjective. That requirement applies equally to an academic prototype, a commercial product, and a community-built collector.
A mesh has several jobs at once
The geometry of a fog collector creates a trade-off. It must present surfaces on which droplets can arrive while allowing air to move through the structure. Once water has accumulated, it needs a route out. Simply covering more of the opening with material is therefore not an unqualified improvement. The surface that helps interception can also alter the airflow or hold water in places where it does not drain usefully.
Park and colleagues explored these competing requirements in their 2013 work on permeable fiber networks. Their laboratory study combined mesh geometry, wettability, and a model of collection, reporting approximately fivefold improvement over a conventional polyolefin mesh under representative test conditions. The work treats drainage and re-entrainment alongside interception; its result is not a claim that every coated mesh delivers five times as much water at every outdoor site. The author-hosted manuscript was accessible for this account. Primary manuscript.
The design problem resembles a busy transfer station more than a sponge. A successful arrival is only the beginning. If the next transfer fails, the apparent success at the first stage becomes an accumulated queue. In a collector, water remaining on the mesh may be visible and impressive while the useful output stays small. This analogy is an explanatory aid rather than a physical model: it helps keep the final destination in view when evaluating a surface that looks exceptionally good at catching droplets.
It also changes how a demonstration should be filmed. A close-up can establish that droplets form and move, but a wider view should show the collection vessel and the complete test interval. Before-and-after weighing, a recorded duration, and a clearly described inlet condition are more informative than an edited sequence of large drops. Spectacular footage is not inherently misleading. It becomes misleading when the viewer is encouraged to treat an aesthetically convincing intermediate process as a measured water supply.
The first drop and the last drop belong in the accounting
A field experiment by Montecinos and colleagues, available online in April 2018, evaluated complete fog events at El Sarco in Chile. Measured efficiencies ranged from zero to 36.8 percent in the analyzed events. A delay of up to an hour could separate fog arrival from collected output, and some short isolated events produced none. The authors measured water reaching the collection system against estimated incoming liquid-water flux over the event. Those findings are site- and event-specific, not universal thresholds. Original field study.
The broader lesson for measurement design is about the clock. Imagine two devices tested for a brief interval. One begins draining quickly but later delivers a moderate rate. The other starts slowly and eventually delivers more. Selecting only the final few minutes favors the second; selecting only the beginning favors the first. A real application with many short episodes might value the quick start. A site with prolonged episodes might value the sustained rate. The right comparison depends on the distribution of operating conditions, not on a preference for either device.
The same issue appears when a test stops before stored droplets finish draining. If those drops enter the collection vessel later, should they be credited to the previous interval? A laboratory can define that convention precisely. A field record needs a convention too, especially when events follow closely together. Without it, a change in event classification can produce an apparent change in performance even when the physical system has not changed. Such bookkeeping is not a distraction from engineering; it determines what the performance figure means.
For a reader, the practical question is whether a reported rate is an instantaneous peak, a period average, or a complete-event total divided by duration. Each can be useful. Only one may match the proposed use. A graph with time on its horizontal axis often reveals more than a single maximum, because it preserves the beginning, the interruption, and the recovery. Those features tell the operator how the device behaves rather than merely how well it behaved at its best moment.
Why surface chemistry is not a one-word answer
Popular descriptions sometimes reduce a material to whether it attracts or repels water. That vocabulary is an introduction, not a complete specification. A useful collector must be evaluated as a structure operating over time. The engineering question is whether the combination of geometry and surface behavior produces a favorable sequence of collection and release under the relevant conditions. A property that sounds desirable in isolation may create an unwanted effect elsewhere in that sequence.
Mukhopadhyay and colleagues examined pore clogging in work posted in January 2024 and revised in April. Their abstract describes numerical and experimental investigation of mesh pitch, shade coefficient, and wettability, including trade-offs associated with strongly water-repellent fibers. The accessible abstract supports an account of the studied design variables and the authors' proposed optimum conditions, not a claim of verified multiyear outdoor performance. This is a distinct study from the earlier fiber-network experiment. Author-posted research abstract.
A separate study by Saha and colleagues, posted in March 2024 and associated with a conference contribution, investigated droplet detachment from horizontal cylindrical fibers. Its abstract reports dependence on fiber diameter and wettability, together with time-dependent behavior under the tested fogging condition. That is evidence about a component process, not a complete community water system. It is useful precisely because it asks what happens at a stage that a simple daily yield figure cannot resolve. Primary research abstract.
These distinctions suggest a sensible hierarchy of claims. A surface measurement characterizes a material. A component experiment tests a mechanism. A complete collector trial measures integrated performance. An operating installation tests the service. Results can inform the next level without automatically establishing it. This hierarchy is not a ladder of prestige: a carefully designed component experiment may be more scientifically informative than a poorly documented installation. It is a way of matching a conclusion to the level at which evidence was actually collected.
Area can change the apparent winner
A rate expressed per square meter sounds standardized until the square meter is defined. Is it the frontal area presented to the approaching flow, the unfolded surface area of a folded material, or the ground area occupied by the installation? These are different quantities. A folded surface can contain more material within a given frontal outline. A structure can occupy land beyond its collecting face because of supports, access routes, and spacing. Each denominator answers a legitimate but different question.
Suppose, as a purely hypothetical comparison, that a flat device collects two liters in an hour through a one-square-meter frontal outline. A folded device in the same outline collects three liters but uses two square meters of material. Per frontal square meter, the folded device performs better. Per square meter of material, its output is lower. Neither calculation disproves the other. The relevant choice depends on whether the limiting resource is exposure area, material cost, transport weight, or some combination of constraints.
The ambiguity becomes greater when discussing a whole hillside. A map may identify a large area with favorable fog conditions, but that is not the same as an equal area of installed mesh. A development plan must decide where structures can stand, how people reach them, and how water leaves the site. Multiplying a regional area by a collector-area yield without explaining the conversion can create an enormous and physically misleading total. The arithmetic may be correct while the assumed equivalence is wrong.
A clear report can avoid that problem with an ordinary sentence: this yield is normalized by the collector's frontal area, while this map describes land with potential exposure. Keeping those categories separate allows designers to investigate realistic layouts later. It also helps the public distinguish a resource assessment from a construction proposal. The map identifies where a possibility deserves examination; it does not silently authorize every square meter to become an operating device.
A promising map is not a filled tank
Carter and colleagues published their Alto Hospicio assessment in February 2025. They combined local collector observations from 2023–2024 with modeling that used 2018 meteorological inputs. The modeled annual-average collection potential around the city ranged from roughly 0.2 to five liters per square meter per day in suitable higher terrain. The paper distinguishes those estimates from the much lower measured collection at one station near the cloud base. Treating the modeled seasonal peaks as a citywide observed supply would erase that distinction. Original assessment.
A resource map is best read as a set of hypotheses with spatial structure. It can help decide where to place observations or which alternatives merit comparison. It should not be forced to answer questions it was not built to answer, such as the reliability of a particular distribution pipe or the price a household would pay. Those questions require additional information even if the atmospheric model is excellent. The value of the map lies partly in directing that additional effort efficiently.
Consider an imaginary municipality with three candidate sites. One has the highest modeled annual collection but difficult access. Another has less predicted yield but lies close to existing storage. A third offers convenient land ownership but uncertain exposure. A single ranking by expected water volume would favor the first site. A ranking by deliverable service might not. An initial pilot could rationally favor the second while retaining the first as a longer-term option. That is a decision under multiple constraints, not an argument against using models.
The important discipline is to keep uncertainty attached to the variable that carries it. An uncertain cloud exposure estimate should not be hidden inside an unexplained contingency budget. An uncertain land agreement should not be represented as a meteorological confidence interval. Separate uncertainties can then be reduced by appropriate actions: observing the site, clarifying access, testing a layout, or negotiating operating responsibilities. A single broad statement that the project is uncertain gives decision-makers much less help.
The arithmetic of clear days
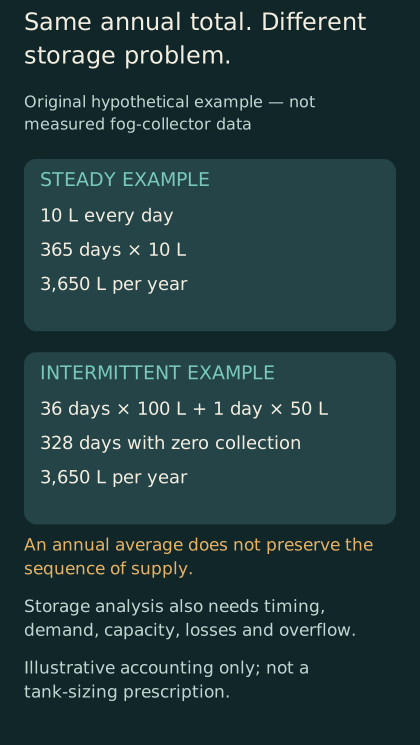
Original illustrative arithmetic: equal annual totals do not imply equal timing or storage requirements. No measured collector performance is plotted.
Annual totals can conceal a difficult service problem. Imagine two hypothetical collectors that each supply 3,650 liters in a year. One delivers ten liters every day. The other delivers one hundred liters on each of thirty-six days and fifty liters on another day, with nothing on the remaining days. Their annual average is identical. Their requirements for storage and backup are plainly different. No knowledge of the collector material is needed to see the distinction; it follows from the timing of supply.
Now give the user a steady demand of eight liters a day. The first hypothetical system has a daily surplus. The second may still run out during a long clear interval, despite producing more water over the year than the annual demand. A sufficiently large and suitably managed storage system could change the outcome, but its required capacity depends on the sequence of arrivals. Sorting daily yields from highest to lowest destroys information needed to analyze that sequence. A duration curve is useful, but it cannot replace the calendar.
A simple storage ledger makes the logic visible. Begin each day with the previous day's stored volume, add the new collection, subtract the intended withdrawal, and account for any losses or overflow. The result is the next day's starting volume, subject to the tank's capacity. This is an illustrative accounting framework, not a sizing prescription. It shows why an impressive average does not by itself establish that a proposed service will be available when someone needs it.
The same ledger can reveal where improvements matter most. If a small tank repeatedly overflows on foggy days and runs dry later, extra peak collection may add little useful supply. More storage, different demand scheduling, or a complementary source could be more valuable. If the tank seldom fills, increasing collection might be the priority. A material breakthrough and a storage improvement should therefore be compared at the point of use, rather than assuming that the component with the newest science must offer the greatest practical benefit.
Measure availability alongside productivity
An installation that produces excellent water volumes when operating can still perform poorly if it is frequently unavailable. For an illustrative comparison, imagine one collector that delivers twenty units on each operating day but operates only half the days when collection would otherwise be possible. Another delivers fifteen units but remains available on all those days. Their nominal rates favor the first; their total useful output can favor the second. The example does not assign realistic failure rates to any technology. It demonstrates why availability belongs in the performance description.
A useful operating record would separate no-fog days from equipment outages. Combining them into a single zero-output category makes diagnosis harder. An atmospheric limitation requires a different response from a blocked drain or a damaged support. Likewise, a sensor failure should not be silently recorded as zero collection, nor should a missing value disappear from the denominator. The distinction between no water and no observation is basic to interpreting any time series, but it is especially important when output is intermittent.
Repair time also matters. A replacement component that can be obtained locally may restore service quickly, while a specialized part with excellent laboratory characteristics may create a long interruption when it fails. This is not a blanket preference for simple materials. A specialized component can justify its complexity if the supply chain and maintenance plan support it. The comparison should include the whole arrangement rather than treating repairability as an afterthought after a procurement decision has already been made.
Such records need not be elaborate to be useful. Consistent categories, dates, and a clear explanation of what was measured can reveal whether performance changes coincide with maintenance, weather, or instrument problems. The aim is not to burden operators with paperwork unrelated to their work. It is to preserve the information that turns a disappointing season into a diagnosis instead of a mystery. Without that record, both successful and unsuccessful projects lose opportunities to teach the next installation.
Water quality is a separate acceptance test
The appearance of clear water cannot establish suitability for drinking. Nor can a statement that the collector is passive. Passive describes an aspect of how the device operates; it is not a water-quality result. This article does not provide treatment instructions or certify any water source. The appropriate requirements depend on intended use, local standards, the collection environment, the materials in contact with water, and the complete storage and distribution arrangement.
The distinction can be expressed without pretending to set those requirements. A performance test asks how much water was delivered under specified conditions. A quality assessment asks what is in representative samples and whether that meets the relevant criteria. A service assessment asks whether appropriate water reaches the intended users consistently. Passing one does not logically imply passing the others. Keeping these questions separate protects both users and researchers from conclusions that the available measurements cannot support.
Sampling also has a timing problem. A single favorable result is a statement about the sampled water, not a permanent certificate for every future condition. A project should be able to explain who is responsible for interpreting results and responding when the intended standard is not met. That is a governance question as well as a technical one. A beautifully engineered collector does not eliminate the need for an accountable organization capable of making and communicating those decisions.
For public reporting, the language should track the evidence. Collected water is an accurate description when collection has been demonstrated. Water intended for irrigation describes a proposed use. Drinking water requires support appropriate to that claim. The labels need not diminish the achievement of harvesting a difficult resource. They prevent an engineering success from being converted into a broader health assurance that the experiment was never designed to establish.
Combining functions creates a new system boundary
Zhang and colleagues reported a proof-of-concept system in May 2025 that combined fog-to-water conversion with a droplet-driven electrical component for producing nitrogen-containing plant nutrients. Their study describes a conversion efficiency of about thirty-five percent under its experimental conditions and tests involving plant growth. It is evidence for an integrated experimental concept, not a demonstrated replacement for a farm's irrigation and fertilizer supply. Its projected large-scale benefits remain projections. Original study.
This kind of integration is scientifically interesting because one output can become another process's input. It also makes evaluation more demanding. A project now has to explain both the water pathway and the additional function. If an integrated unit is compared with a simple collector, the comparison should acknowledge what each unit is intended to do. A device optimized for several outputs may not lead on every individual metric. That is not a flaw, provided the combined value and the new constraints are made explicit.
An analogy from ordinary accounting helps. A business with two products cannot establish the profitability of both by showing only its highest revenue stream. Likewise, a multifunctional prototype needs an account of what was supplied, what was consumed, and what was measured for each output. Demonstrating that two functions can be coupled is an important first step. Demonstrating that the coupling remains useful under variable outdoor conditions is a further question, not an insult to the original experiment.
The same caution applies to the phrase self-sufficient. Its meaning depends on the boundary and the timescale. A laboratory process may operate without a particular external input during the reported test while still depending on manufactured components, maintenance, or the environmental conditions that make the process possible. A careful description states the excluded input rather than allowing readers to infer independence from every supporting resource. Precision makes an ambitious result easier to evaluate and, ultimately, more credible.
What a fair outdoor comparison would preserve
Imagine a research group comparing two designs over a season. A persuasive result would preserve the differences that matter while controlling the differences that do not belong to the question. If one collector sits in a more favorable exposure, a higher yield might reflect location rather than design. If instruments differ, the comparison might include calibration effects. If maintenance is applied unevenly, the result might compare operating practices as much as materials. These are hypothetical design concerns, not allegations about any study cited here.
A well-explained trial would state the comparison it intends to make. Is it testing equal frontal area, equal material expenditure, equal installation cost, or complete systems as supplied? There is no single universally correct choice. Equal-area trials help isolate collection behavior. Complete-system trials may better represent a purchasing decision. The danger comes from conducting one kind of test and presenting its conclusion as though it answered the other. Stating the intended comparison in advance helps prevent that shift.
The record should also retain unfavorable periods. A design that excels only within a narrow range can still be useful if the intended site frequently occupies that range. Removing the periods outside it makes the evidence less useful, because those periods help define the operating envelope. A strong paper does not need its prototype to win every comparison. It needs the reader to understand where the prototype wins, where it does not, and how confidently those boundaries have been identified.
Finally, a seasonal comparison should be described as a seasonal comparison. It cannot establish lifetime durability by extrapolation alone. Long-term evidence may be unavailable when a promising design first appears, and that is an honest limitation rather than a reason to suppress the result. The next stage can be planned around that missing evidence. Progress becomes cumulative when each experiment leaves a clear account of what has been learned and what remains to be tested.
Cost per liter needs a useful liter
A cost comparison can be transformed by its denominator. Dividing purchase cost by the highest observed daily output gives a different impression from dividing lifetime costs by delivered water that meets the intended service requirements. Neither calculation is difficult in principle. The challenge is that the second requires more evidence and more assumptions. A credible estimate makes those assumptions visible, especially the lifetime, replacement schedule, available collection days, and handling of periods with no service.
Take a deliberately simplified example. System A costs one hundred accounting units and is expected to deliver one thousand useful volume units over its life. System B costs one hundred and fifty and is expected to deliver two thousand. Ignoring all other costs, B has the lower cost per useful unit despite its higher purchase price. If half its predicted output cannot be used because of timing or storage constraints, that advantage changes. These invented numbers illustrate sensitivity; they are not estimates for an actual fog project.
This is why a financial comparison should distinguish collected volume from usable volume. Water that overflows unused, cannot reach its intended destination, or fails the intended acceptance criteria may still be physically collected. Counting it as delivered service overstates the benefit. Conversely, a collector that displaces an especially costly or difficult existing source could have value beyond its raw volume. Such benefits need their own evidence rather than being presumed from the presence of a novel device.
Costs borne by operators also deserve visibility. A low purchase price can conceal substantial unpaid time, difficult access, or recurring administrative effort. The point is not to attach a universal monetary value to every task. It is to avoid presenting an apparently inexpensive installation as though maintaining it required no one's labor. An honest project account can recognize those contributions without treating the people who make the system function as an unlimited free input.
The most useful pilot may answer an unglamorous question
A pilot installation can be designed to produce a striking demonstration, or it can be designed to resolve the uncertainty that most affects the next decision. Sometimes those goals align. Sometimes the decisive uncertainty is mundane: whether a drain remains accessible, whether records can be kept consistently, whether a tank can be managed through a clear interval, or whether the intended users actually want the proposed service arrangement. An impressive collection rate does not answer these questions by itself.
An explicit decision rule improves the value of a pilot. Before it begins, the organizers can state what evidence would justify expanding, modifying, or ending the trial. This need not mean pretending that every uncertainty can be reduced to a single threshold. It means identifying the questions that will matter later so that the pilot records the necessary information. Otherwise, a project can reach its review date with many photographs and too little evidence to make a confident decision.
Negative findings can be particularly useful when they identify a boundary. A poor site may teach more about regional placement than another successful demonstration at an already favorable location. A repair problem may reveal a design change needed before expansion. A mismatch between seasonal output and demand may suggest a complementary use rather than abandonment. Calling every limitation a failure wastes that information; calling every limitation a minor detail is equally unhelpful.
The strongest pilot report would therefore tell a complete story of the trial, including what the team expected, what it measured, what surprised it, and which decisions follow. It would distinguish technical results from users' preferences and from institutional commitments. That separation helps others adapt the lessons without copying the entire arrangement blindly. A fog collector is installed in a place, but the evidence it produces can be useful far beyond that place if its conditions are documented clearly.
Keep the weather record and the maintenance record in conversation
A subtle evaluation problem appears when a new material is installed at the same time as other improvements. Suppose a hypothetical project replaces its mesh, repairs a leaking connection, and begins cleaning its collection vessel more regularly. The following season produces more delivered water. That is good news for the project, but the increase cannot be attributed entirely to the new mesh without further evidence. The intervention was a package. Reporting the package honestly preserves the useful result while avoiding an unsupported explanation of its cause.
The reverse can happen too. A promising material might be introduced during an unusually unfavorable collection season. Lower total delivery would not, by itself, prove that the material performed worse. The evaluation needs some way to distinguish changing exposure from changing device performance. A simultaneous reference collector is one possible research approach; a well-characterized environmental record is another source of information. Neither automatically resolves every difference, and the appropriate design depends on the question. The general point is to avoid confusing chronology with attribution.
This matters when projects compare themselves across countries. A collector in one climate is not a controlled experiment against a collector in another. Differences in daily yield may reflect exposure, event timing, installation geometry, measurement conventions, or maintenance. An international table can still be useful as a catalogue of experience, provided the entries retain their context. It becomes less useful when it is treated as a league table in which the largest value identifies the best technology regardless of conditions.
A more revealing comparison might ask how much each project learned about its own limiting factor. One installation could discover that its source is abundant but storage is inadequate. Another could find that its equipment performs well but fog arrives too rarely for the intended demand. A third could identify a distribution bottleneck. These are different diagnoses with different next steps. Gathering them under a single verdict that fog harvesting works or does not work would discard the information needed to improve any of the projects.
The reporting format can support better interpretation by keeping paired records together: collection and weather, delivery and storage, downtime and repair, expenditure and useful output. This is an original proposal for organizing evidence, not a claim that every operating project already follows it. A paired record encourages the reader to ask about mechanisms and alternatives rather than selecting a favorable number in isolation. It also makes later reassessment possible when a new design or a changed service goal creates a different question.
For the community considering an installation, that clarity has practical value. People can see which part of the proposal rests on observed local evidence and which part remains an assumption. They can also identify who should answer each unresolved question. The discussion then becomes less dependent on whether a presentation feels optimistic or pessimistic. It becomes a negotiation over specific evidence, responsibilities, and acceptable uncertainty—the conditions under which a small technical intervention can become a durable public service.
A smaller promise can be the stronger achievement
Fog harvesting does not need to promise unlimited water to be worth investigating. A well-matched supplementary source can be valuable precisely because its role is specific. It might serve a defined seasonal demand or reduce reliance on another source during a particular period. Whether that is worthwhile depends on evidence from the intended setting. The achievement is not made larger by describing it as a universal solution; it is made more defensible by showing the actual contribution.
The studies discussed here operate at different scales, from the behavior of drops on fibers to models of resource potential around a city. None needs to answer every question to contribute something useful. The task for readers, planners, and researchers is to connect those contributions without collapsing their boundaries. A laboratory comparison can motivate a field test. A field record can inform a resource model. A resource model can guide a pilot. Each connection requires an explicit argument rather than an automatic transfer of confidence.
The compelling image remains a net standing in cloud, releasing water into a gutter. The more consequential image is less dramatic: a dated record of what entered storage, what was delivered, when the system was unavailable, and who kept it working. That record is where an inventive material becomes an assessable water service. The fog supplies an opportunity. The complete system determines whether the opportunity becomes something people can rely on.