
Moisture transport, mountain orientation, storm duration, and the wetness already in the ground connect an ocean forecast to a river response.
The name atmospheric river invites a picture of a river suspended in the sky. The useful part of the metaphor is transport: water vapor is moving through the atmosphere in a concentrated corridor. The misleading part is the suggestion that a fixed volume simply pours onto the land beneath it. Between atmospheric moisture and a flooded street lie several transformations. Air must produce precipitation; that precipitation reaches a landscape with its own shape and prior condition; water then moves through soils, channels, and infrastructure.
The observation effort now follows more of that pathway. CW3E's Coordinated University Sounding Program reports that its network expanded to fifteen universities and launched more than 470 radiosondes during the 2026 season, compared with fewer than one hundred in 2025. The program collects atmospheric profiles in coordination with reconnaissance missions. Those figures describe observation activity, not a measured percentage improvement in flood forecasts. The program page, accessed on November 1, 2026, provides a current hook for examining what additional measurements can and cannot establish. Primary program record.
A complementary result comes from a 2025 study of 122 US West Coast watersheds. Webb and colleagues found a robust nonlinear relationship between antecedent soil moisture and atmospheric-river streamflow in most of the studied watersheds. Above watershed-specific moisture thresholds, event maximum streamflow was, on average, two to four and a half times larger. The USGS author abstract supports those findings; it does not supply a universal threshold that can be applied to every basin or used as local flood advice. Original study record, April 24, 2025.
Together, the two developments illustrate why a better account of atmospheric rivers must look both offshore and beneath our feet. More atmospheric information can improve the description of an approaching event. Better understanding of the land can improve the interpretation of its possible effects. This article explains the chain between them through seven primary works and original conceptual examples. It is an account of research and measurement, not a live forecast, reservoir operating instruction, or property-specific flood assessment.
Water present and water moving are different quantities
A column of air can contain water vapor, and wind can transport that vapor horizontally. The amount present and the rate of transport are related but different. Integrated vapor transport, commonly abbreviated IVT, combines information about moisture and wind through a depth of the atmosphere. It is therefore more than a map of how humid the air is. A comparison that treats moisture content and transport as synonyms loses part of the physical meaning.
The distinction is familiar in other settings. A warehouse can contain a large stock of goods while moving them slowly through its doors. Another can hold less at a moment but move goods rapidly. The analogy explains stock versus flow; it does not reproduce atmospheric dynamics. For an atmospheric river, the relevant transport also has a direction, and that direction helps determine how the moving moisture encounters land.
Units make the distinction visible. A transport quantity expressed as mass per unit width per unit time is not a rainfall depth. To infer rainfall at a place, additional processes and geometry must be considered. A large transport value can identify an important atmospheric feature without directly stating how many millimeters will fall in a particular catchment. Converting a vivid transport comparison into a local rainfall total by intuition is not a valid calculation.
The same caution applies to descriptions comparing atmospheric transport with the flow of a famous surface river. Such comparisons can convey scale, but they can also encourage readers to imagine a channel of liquid water arriving intact. A useful explanation should state what is being compared and avoid letting the metaphor replace the measurement. The atmosphere is transporting vapor through a three-dimensional system, not delivering a tanker with a fixed discharge point.
For a forecast reader, this creates a simple sequence of questions. What does the map show: moisture content, vapor transport, precipitation, or streamflow? What are its units? What period does it represent? Which direction is the transport moving? These questions help locate the product within the chain from atmosphere to impact. They do not require the reader to calculate a forecast, but they prevent several common category mistakes.
An interface that places these products side by side can be helpful if it preserves their distinct meanings. The same color should not imply the same physical quantity across panels unless the labels make the change clear. A transport map and a rainfall map can both use intense colors for large values while describing different parts of the event. Their relationship is something to explain, not something to assume from the palette.
Duration changes the question
A strong flow of moisture that passes quickly and one that persists over a location can produce different opportunities for precipitation. Duration therefore belongs beside intensity in a description of an atmospheric river. A peak value captures the most intense moment in a defined series; it does not describe how long the conditions lasted. Two events with the same peak can have very different histories.
The atmospheric-river scale introduced in 2019 uses vapor-transport intensity and duration at a location to organize categories of potential benefit and hazard. Scripps' first-party account of the scale describes it as a tool for broad situational awareness, with limits at finer spatial scales where terrain and vulnerability vary. The original journal page was inaccessible during this research; the institutional account is used for the scale's design and purpose, not for additional results from the unread paper. Primary institutional account, February 5, 2019.
A hypothetical time series illustrates what a peak misses. Imagine two invented events whose transport rises to the same maximum. In one, the high values last briefly; in the other, substantial transport continues for a much longer period. The area under their transport curves differs even though the maxima match. That integral is still not a rainfall total, because the conversion to precipitation depends on other conditions. It nevertheless shows why a single peak cannot describe the full exposure to transport.
Duration also depends on the location where it is measured. A moving feature may affect one coastal point for a different length of time than another. An event can therefore receive different local descriptions along its path without the observations being inconsistent. A headline that assigns one label to the entire system should explain whether it refers to a particular location, a maximum along the coast, or a broader summary.
This becomes important when comparing forecasts issued at different times. A small change in predicted timing or track can alter the duration at a selected point. That change may affect the local category even if the broad atmospheric feature remains similar. A reader should look for the underlying revision rather than assuming that every category change represents a completely different storm.
The scale's usefulness does not require it to contain every variable that affects flooding. A concise atmospheric classification can orient attention and support discussion. Problems arise when it is treated as a complete forecast of local consequences. The category should sit alongside precipitation and hydrological information, not displace them. A storm can contribute valuable water and still create serious problems in particular places; the broad label does not decide each local outcome.
Mountains turn direction into geography
The orientation of a moisture-bearing flow relative to terrain can influence where precipitation develops. A map of transport magnitude alone leaves out that directional relationship. A coastline and its mountains are not a uniform wall. Their shape creates a geographical context in which similar atmospheric magnitudes can produce different spatial patterns of precipitation.
Hecht and Cordeira's 2017 study examined atmospheric rivers reaching the Russian River watershed in northern California. It grouped events by orientation and intensity and connected those differences with larger-scale flow patterns and precipitation distributions. The results emphasized both upslope moisture flux and broader forcing for ascent. This is evidence from the studied region and period, not a universal conversion rule from a wind direction to a rainfall amount. Original study, July 24, 2017.
An original geometric analogy can make the issue intuitive. Imagine moving a broad sheet of air toward an irregular ridge from different directions. The component directed across the ridge changes with the angle of approach. The analogy does not calculate condensation or precipitation; it shows why direction contains information that magnitude alone lacks. A scalar summary can hide a meaningful difference in how the flow meets the landscape.
The geographical consequence is that adjacent catchments need not respond identically to the same broad event. Their position relative to terrain and the evolving flow can differ. A regional average can summarize the event while missing a localized concentration. The appropriate scale of the product depends on the question being asked. A coastal overview and a basin-specific precipitation forecast serve different purposes.
This is one reason that sharper map detail should not be mistaken automatically for greater certainty. A fine grid can represent terrain more explicitly, but the forecast still depends on the atmospheric state, model formulation, and observations. A detailed-looking pattern may be useful while retaining uncertainty in its position or magnitude. The visual resolution and the confidence in each feature are separate properties.
Reporting can preserve this distinction with a simple description of the evidence. Instead of saying a storm will put a fixed amount of rain everywhere within a broad region, an account can identify the forecast range and where the issuing service expects the greatest impacts, with its stated uncertainty. This article provides no such current forecast. The point is that terrain-sensitive language should come from the actual product rather than from a generic assumption about which side of a mountain must receive the most water.
The ground remembers earlier weather
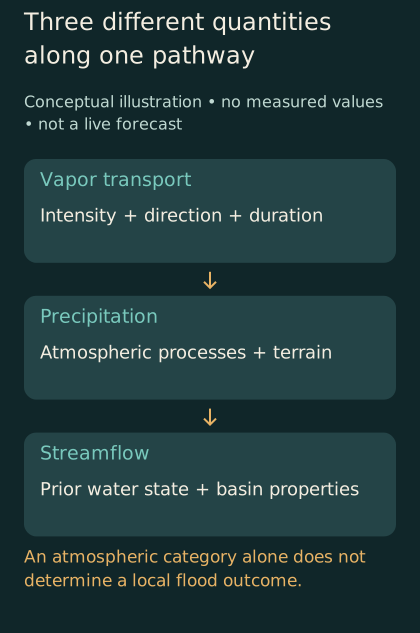
Conceptual pathway separates vapor transport, precipitation, and streamflow. Terrain and the watershed's prior condition affect the translation; no numerical forecast is shown.
An approaching atmospheric river reaches a watershed that already contains water in various places. The state of that watershed can influence how additional precipitation becomes streamflow. The word antecedent simply directs attention to what was present before the event. It is a reminder that the storm does not begin the hydrological account from an empty page.
Sumargo and colleagues developed and analyzed a soil-moisture observation network in northern California's Russian River basin, with measurements at multiple sites and depths. Their 2021 paper examined how the observations could characterize runoff-related behavior and support model design, while acknowledging local heterogeneity. The accessible NOAA-hosted document is an accepted manuscript. It supplies a concrete example of measuring the land's prior condition rather than inferring all impacts from the atmosphere alone. Original monitoring-network study.
A simple hypothetical storage model illustrates the logic. Imagine two otherwise identical containers with limited remaining capacity. One begins nearly empty; the other begins nearly full. Add the same amount to each, and the overflow can differ. A watershed is not a rigid bucket, and this analogy omits many pathways and processes. Its purpose is to show why the starting state can change the response to the same input.
The limits of the analogy are as important as its usefulness. Water can move through a watershed along multiple routes and on different timescales. Soil properties vary, vegetation interacts with water, and channels connect parts of the landscape. A single storage number may summarize part of the situation without describing every relevant process. A model should be judged by whether its simplifications support the question it is being used to answer.
Measurements at different depths can reveal different aspects of that starting state. A shallow observation need not describe the entire soil profile. A point measurement need not represent a whole basin. A remotely estimated quantity may cover a broader area while relying on a different sensing depth or analytical relationship. These distinctions should remain visible when products are combined into a hydrological assessment.
For the public, the important conclusion is conditional rather than numerical: the same atmospheric category can reach landscapes with different prior conditions. A lower atmospheric category should not be converted into a blanket assurance of harmlessness, and a higher category should not be treated as a precise property-level flood prediction. Current local warnings and hydrological forecasts are needed to interpret actual conditions. A research result about antecedent moisture explains why those additional products matter.
A sequence of storms is more than a list
Weather reports often count successive atmospheric rivers, especially during an active period. The count can communicate persistence, but it does not fully describe the sequence. Events differ in their timing, location, intensity, and the conditions left behind. The interval between them can matter as much as their order in a numbered list.
Consider an invented sequence of three events affecting the same hypothetical basin. The first changes the basin's water state; the second arrives before much of that change has dissipated; the third takes a different path and affects another part of the landscape. Counting three events gives a useful overview but hides the interactions. A hydrological analysis needs the evolving state rather than resetting the basin to the same initial condition before each event.
The distinction also affects attribution. If high streamflow occurs during the second event, how much of the response reflects the second event's precipitation and how much reflects conditions established earlier? The answer depends on the definitions and methods used in the analysis. A report should avoid treating the event boundary as though it were a physical wall that separates all causes cleanly.
A sequence can also complicate the meaning of a storm total. Does the total include one meteorological feature, all precipitation over a calendar interval, or the water associated with a hydrological response? These definitions may overlap without being identical. When studies or news accounts use different boundaries, their totals can differ for reasons other than an error in measurement.
An informative timeline could show the atmospheric events, precipitation intervals, and streamflow response separately. It would not need to imply that the curves match exactly or that one peak causes another without delay. The purpose would be to help readers see the sequence of inputs and responses. A timeline that collapses all three into a single dramatic line risks making the chain appear simpler than the evidence supports.
This is also a reminder that recovery between events deserves attention. Infrastructure, monitoring systems, and response organizations may be affected by a sequence even when each event is described separately in the forecast. The scientific account of the atmosphere is one part of the broader preparedness picture. A responsible article should distinguish those layers rather than expecting one storm category to summarize the cumulative demands on a community.
Profiles fill a different gap from surface measurements
A weather observation at the ground describes conditions at its location and height. A profile through the atmosphere adds information about how temperature, moisture, and wind vary vertically. That structure can matter to an analysis of transport and precipitation. The value of a profile is therefore not simply that it is another data point; it measures a dimension that a surface observation cannot fully supply.
Radiosondes and dropsondes provide profiles through different deployment methods. This article does not provide instructions for deploying instruments or conducting aircraft missions. The relevant distinction is between observing a vertical structure and inferring it from other information. A profile can help constrain an atmospheric analysis, while the usefulness of a particular observation still depends on its quality, location, timing, and assimilation into the forecast system.
An original hypothetical example makes the vertical issue visible. Two atmospheric columns could have similar values at the surface while differing aloft. If a forecast uses only the surface similarity to infer that the columns are alike, it misses information about their vertical structure. A profile can reveal that difference. The example does not assert a particular rainfall outcome; it explains why observations at one height do not uniquely determine the full column.
Observation timing matters as well. A profile collected before an event reaches a location describes a different state from one collected after it passes. A network's schedule and latency determine which information is available to a forecast cycle. An observation that arrives too late for one cycle may still support later analysis, but its role should not be described as though it had informed the earlier forecast.
This distinction is important when reporting a successful field campaign. A count of launches or flights demonstrates effort and coverage. It does not by itself quantify forecast benefit. To establish that benefit, researchers need an evaluation that connects the added observations to changes in forecast performance under a defined comparison. The operational achievement and the scientific performance claim are related, but they require different evidence.
The public-interest value of the observation network therefore includes both immediate information and the opportunity to study what information matters. A well-documented campaign can support future decisions about where and when to observe. Its legacy is stronger when the data, methods, and limitations remain available beyond the photographs of instruments being released.
How researchers test whether extra observations help
A common approach to studying an observation's contribution is to compare forecasts produced with and without a selected input while holding other aspects of the experiment as consistent as possible. Such a data-denial experiment can help isolate the contribution within the tested system. Its interpretation still depends on the cases, model, assimilation method, and verification target used.
Zheng and colleagues studied different dropsonde sampling strategies during a six-day January 2021 reconnaissance sequence. CW3E's January 2024 first-party account describes experiments varying mission frequency, spacing, and aircraft contributions, with consequences for atmospheric-river and precipitation forecast skill. The accessible source here is the authors' institutional account; the large original-paper PDF exceeded the retrieval tool's size limit. The conclusions are therefore kept to the bounded experiment described in that account. Primary research-team summary.
The experiment's logic can be explained with a hypothetical comparison. Suppose a forecast system produces two runs for the same set of cases. One includes a selected observation stream, and the other excludes it. A difference in their errors can indicate the stream's contribution under that setup. It does not automatically tell us how the same observations would affect a different model, another region, or a different period. The comparison is informative because its conditions are specified.
Verification also needs a target. Improvement in the representation of atmospheric transport is not identical to improvement in precipitation at every location. Improvement in precipitation does not automatically establish improvement in peak streamflow. A study can examine several targets, but each should retain its own result. A summary that replaces them all with better flood prediction can overstate what was evaluated.
The choice of metric matters. A measure of average error emphasizes different aspects of performance from a measure of whether a threshold was exceeded in the correct place. A forecast can improve on one metric while changing little on another. That pattern is not inherently contradictory. It tells us that performance has several dimensions and that the metric should be selected for the question rather than for the most attractive result.
A strong public summary therefore names the evaluated variable, the forecast lead time, the case set, and the comparison. It avoids turning a percentage improvement in one score into a universal reduction in uncertainty. The more specific statement may sound less dramatic, but it is more useful to researchers and decision-makers trying to understand what the added observations actually contributed.
A positive result can still have qualifications
A short primary technical report by Wu and colleagues evaluated dropsonde impacts in the GFS for forty intensive observing periods during the 2023–2024 reconnaissance season. It reported generally positive precipitation-score changes, while improvements in several broader atmospheric variables were not statistically significant. The report is a two-page technical contribution, not a complete demonstration that every forecast or flood outcome improved. Both the positive findings and their qualification belong in the account. Original technical report.
This kind of result is useful because it resists a binary story. An observation system does not have to improve every variable in every case to contribute value. At the same time, a favorable average does not justify claiming that all users or all events benefited equally. The practical question is where the improvement occurred, how reliably it appeared, and whether it supports the intended application.
Statistical significance is one part of that interpretation, not a substitute for it. A result described as not statistically significant under a study's test should not be promoted as conclusively established. It also should not be translated automatically into proof of no possible effect. The estimate, uncertainty, sample size, and study design help explain what the test can distinguish.
An original hypothetical example illustrates the issue. Two experiments could estimate similar average improvements, but one could contain many more independent cases and therefore constrain the average more tightly. Another could have substantial case-to-case variation. Their headline percentages might match while the evidence supporting a general conclusion differs. Reporting the percentage alone would hide that distinction.
The independence of cases also deserves attention. Successive forecast times during one event may be related. Treating them as though they were entirely separate storms can exaggerate the apparent amount of evidence. A careful study addresses the structure of its sample. A reader need not reproduce its statistics to ask whether the reported number of cases corresponds to genuinely independent information.
For public reporting, the best habit is to keep the qualification next to the claim. A result should not be celebrated in the opening paragraph while its limits are buried far below. The point is not to weaken every finding with ritual caution. It is to preserve the conditions that make the finding scientifically meaningful.
The final link is a place, not a color
Even a good atmospheric and hydrological forecast does not directly describe every consequence for every household. Exposure, drainage, infrastructure condition, and the location of people and assets affect what a water event means in practice. A regional hazard product and a property-specific assessment operate at different levels. An article should not bridge that gap with intuition alone.
Consider two hypothetical neighborhoods receiving similar rainfall. Their drainage pathways, surface cover, elevations, and infrastructure could differ. The same input need not produce the same disruption. The example does not estimate either neighborhood's risk; it explains why a regional rainfall total cannot be converted into a household guarantee without local information.
A river gauge has its own geographical meaning. It reports conditions associated with a particular point and measurement system. A high value there can be important without describing every tributary, street, or drainage problem nearby. A map that combines gauges should preserve their locations and the definitions of displayed quantities rather than making the whole region appear uniformly measured.
This distinction is especially important in communication about beneficial water. A storm can contribute to water supply while also producing harmful local consequences. Those statements concern different outcomes and possibly different places or times. A broad benefit-versus-hazard label should not be used to dismiss local warnings, nor should a damaging event erase the role of precipitation in a region's water system. The account can hold both facts without forcing one to cancel the other.
For actual decisions, current official warnings and instructions take precedence over a general explanatory article. This piece does not assess whether a road is passable, a property is safe, or a reservoir should release water. Its purpose is to explain why those decisions require the appropriate local and operational information, rather than a single atmospheric label repeated without context.
The most useful public-interest reporting follows the chain carefully: atmospheric observations inform a forecast; the forecast describes likely precipitation; hydrological analysis considers the watershed; local authorities and specialists interpret consequences within their responsibilities. Each link has its own evidence and limits. Understanding the chain makes it easier to recognize both genuine progress and claims that skip necessary steps.
Three clocks in one forecast chain
An atmospheric-river forecast can involve several clocks at once. One is the time before landfall. Another is the time during which precipitation affects a catchment. A third is the timing of the hydrological response at a particular location. These clocks are connected, but they should not be collapsed into one countdown. A forecast of arrival does not automatically specify the time of maximum streamflow downstream.
A hypothetical timeline can make the distinction clear. An atmospheric feature approaches a coast, precipitation begins over part of a basin, and water subsequently moves through connected channels. A warning concerning the atmospheric feature might be issued well before a more specific estimate of the river response is available. Later information can refine the local assessment. The sequence does not imply that the earlier warning was defective because it lacked the detail available later.
Lead time is therefore meaningful only when attached to an event and a decision. A forecast issued three days before landfall has one reference point. A forecast issued three days before a streamflow peak has another. If studies use different reference points, their lead-time claims may not be directly comparable. The same applies to a statement that observations improved the forecast beyond a certain number of hours: the reader needs to know which variable and valid time were evaluated.
Operational usefulness also depends on when information arrives relative to an organization's responsibilities. A highly accurate estimate delivered after a decision deadline can serve analysis but may not support that earlier decision. A less detailed product delivered earlier can still be useful if its uncertainty is understood and it answers the appropriate planning question. This is a general timing principle, not guidance for operating a reservoir or issuing an evacuation order.
A project evaluating forecast value should therefore preserve the sequence of available information. Retrospective analysis often has access to corrected observations and later model runs. Those can improve understanding of the event, but they should not be described as though they were available to the people making decisions beforehand. A fair evaluation reconstructs the information state at the relevant time.
The resulting account is more demanding than a single claim of improved prediction, but it is also more practical. It can distinguish improved knowledge of landfall from improved knowledge of basin response, and both from improved decision support. Those distinctions help identify where another observation, a better model connection, or a clearer communication process could make the greatest difference.
What a useful event archive would preserve
An atmospheric-river event archive should retain more than a final map and a rainfall total. For a researcher or journalist returning later, the important record includes the sequence of forecasts, their issue and valid times, the observations used for verification, and the definitions that determine which period and locations belong to the event. Without those details, it is difficult to reconstruct why a forecast changed or what a reported improvement means.
The archive should distinguish raw observations from quality-controlled products and derived indicators. A sensor reading, a corrected time series, and an estimate interpolated across a basin are different objects. Each can be valuable, but a downstream user should know which one is being used. This is especially important when several products share a familiar label such as rainfall or soil moisture while differing in spatial coverage and processing.
A hypothetical comparison illustrates the problem. One analyst might calculate a storm total from a set of gauges, while another uses a gridded product covering the whole catchment. If the results differ, the first question is not which analyst made a mistake. It is whether the products represent the same area, interval, and quantity, and how each handles locations without direct observations. Only after those questions are addressed does the remaining discrepancy become interpretable.
Event definitions also deserve version control. A study may identify atmospheric rivers using a particular algorithm and threshold convention. Another may group or separate events differently. The resulting event counts can differ even when both analyses use credible data. A report should preserve the identification method rather than treating the number of events as a self-evident fact independent of definitions.
This matters for public claims about trends as well. A longer catalog assembled with one consistent method answers a different question from a collection of news reports whose terminology changed over time. A responsible comparison identifies the observation and classification system behind the trend. It does not infer a physical increase merely from more frequent use of a phrase in headlines.
Finally, an archive should preserve the distinction between a research product and an operational warning. A retrospective reconstruction may provide an excellent account of what happened without being a product designed for live use. A prototype indicator may help investigate a relationship without having been validated for public decisions. Clear status labels protect both the research and the reader by preventing an exploratory result from acquiring an authority its authors did not claim.
Measuring the handoff between disciplines
The boundary between meteorology and hydrology is an especially useful place to evaluate an information system. A precipitation forecast can be skillful according to one measure while still producing a problematic input for a particular basin model. The issue may concern timing, spatial distribution, precipitation phase, or the representation of uncertainty. An end-to-end evaluation can examine that handoff rather than assuming that an improvement in one component must pass unchanged through the rest of the chain.
A conceptual test could compare several forecast inputs within the same hydrological framework, while separately checking the framework against observed inputs. That structure would help distinguish limitations in the atmospheric input from limitations in the translation to streamflow. It would not remove every ambiguity, but it would make the sources of error more visible than evaluating only the final output.
The same principle applies to communication. A technically sound product can lose meaning when summarized for another audience. The handoff should preserve the variable, period, location, and qualification that make the result useful. A chain is only as interpretable as its connections. Studying those connections is a concrete way to improve atmospheric-river information without promising that one new instrument or model will solve the entire problem.
A better storm story
A familiar storm story begins with a dramatic plume on a map and ends with a predicted impact. A more informative story spends time on the transformations between them. It asks how the flow is oriented, how long it persists, where precipitation develops, and what conditions already exist in the watershed. It distinguishes a measurement campaign from a skill evaluation and a regional category from a local consequence.
This approach does not require a reader to become a meteorologist or hydrologist. It requires attention to a few basic distinctions: vapor content versus transport, peak versus duration, atmospheric input versus watershed response, observed improvement versus proposed benefit. Those distinctions make technical reporting easier to follow because they identify the role of each number instead of presenting a collection of impressive but disconnected statistics.
The research and program records cited here show a field working across those boundaries. Atmospheric profiles add information about the approaching system. Terrain studies explain geographical differences in precipitation. Soil observations and basin analyses reveal the importance of the land's starting condition. Forecast experiments test the contribution of added data rather than assuming that more observations must improve every outcome automatically.
An atmospheric river reaching land is therefore the beginning of a connected explanation, not its conclusion. The moisture has a path, the event has a duration, and the watershed has a history. A forecast becomes more useful when those features are described together, with the evidence for each kept clear. The river in the sky matters. So does the landscape waiting beneath it.