
Behind the familiar five-level scale is a difficult problem of space, snow instability, incomplete observations, and honest warning design.
A colored number on an avalanche map is a small object carrying an unusually large burden. It must summarize conditions across mountainous terrain, reach people with different levels of expertise, and remain understandable when there is little time to read. The compression is useful. It can also encourage a mistaken picture of what a forecast knows: that each colored region contains one uniform condition, that neighboring numbers are evenly spaced, or that a regional bulletin can certify an individual slope.
The Swiss WSL Institute for Snow and Avalanche Research, SLF, published a November 2025 edition of its avalanche-bulletin interpretation guide. The guide describes a regional warning product assembled from measurements, observations, weather forecasts, and snowpack modeling, with explicit limits on what it can say about individual locations. It is a useful current reference for understanding the product, not a live bulletin for any outing. This article examines warning science and communication; it does not provide route selection, slope assessment, or a substitute for current local warnings and qualified avalanche education. Official guide, November 2025 edition.
The central difficulty is that avalanche danger is not a single quantity measured by one instrument. A thermometer can report temperature at its location. A danger assessment combines information about instability, its distribution, and possible avalanche size across an area and period. Researchers therefore face a demanding verification problem: even after the forecast period has passed, the evidence may not supply a perfectly known answer against which to score the forecast.
That challenge does not make warnings arbitrary. It makes their construction and evaluation worth understanding. The following sections examine seven primary research and institutional sources, then develop original examples of how to read, compare, and communicate a regional warning without asking the headline number to do work it was never designed to do. All numerical examples identified as hypothetical are explanatory calculations, not estimates of avalanche probability or advice about travel.
A category has an order, not a ruler
The numbers in a danger scale establish an order. They should not be treated as measurements on a ruler with equal physical distances between marks. If a category changes from two to three, the difference is not automatically the same amount of hazard as a change from three to four. Nor does a category of four imply exactly twice the hazard of a category of two. Arithmetic with category labels can produce a result that looks quantitative while lacking the physical interpretation a reader assumes.
SLF's current description of the scale makes this distinction explicit: danger changes continuously, while the five levels summarize it in categories, and the increase between levels is disproportionate. It also states that a regional level cannot represent the peculiarities of every individual slope. These are descriptions of the warning system as accessed on November 1, 2026, not a report of conditions on that date. Official scale explanation.
An everyday analogy can help without pretending to reproduce snow physics. A queue labeled short, medium, or long can be ordered reliably while still containing a range of actual lengths within each label. Two queues called medium need not contain the same number of people. The analogy explains categorical compression; it does not imply that avalanche categories are assigned using a simple count or that their boundaries are subjective in the same way as casual queue descriptions.
For a data analyst, the distinction affects aggregation. Averaging category numbers across many days can sometimes describe a dataset under a stated convention, but the result should not be advertised as a measured average hazard. A mean category of two and a half is not an operational warning category or a universal physical state. The distribution of categories, their durations, and the circumstances represented may be more informative than a single arithmetic average.
Consider a hypothetical comparison between two winters. One contains many days in an intermediate category; another alternates between lower and higher categories. Their numerical averages could match. Their implications for communication and planning would still differ. A reader who sees only the mean cannot recover the pattern. A useful historical summary would preserve enough of the distribution to show what the average hides.
This issue also matters to visual design. A smooth gradient can suggest continuous precision, while a set of discrete colors can suggest abrupt physical boundaries. Neither implication is automatically correct. The designer needs to communicate that the categories are a structured summary of a continuously varying situation. Labels, explanatory text, and clear map boundaries can help, but the visual should not imply a level of location-specific knowledge that the underlying product does not contain.
The number compresses several dimensions
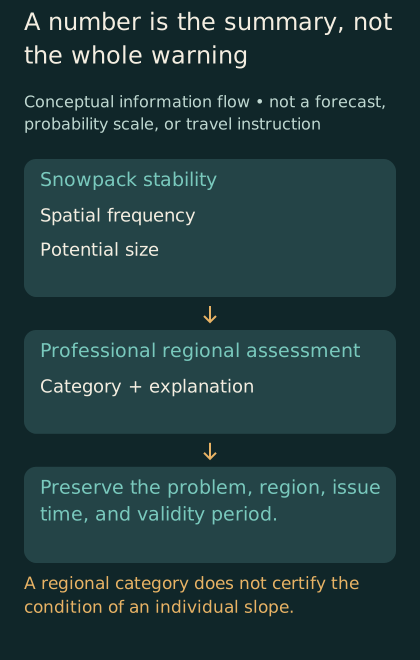
Conceptual information flow, not a forecast. Several dimensions inform a regional category; its explanation and temporal and geographical context remain essential.
The European Avalanche Warning Services workflow describes an assessment of relevant avalanche problems, their locations and timing, snowpack stability, the frequency of unstable locations, and potential avalanche size. The resulting regional level reflects the most severe assessed combination among the relevant problems. This official workflow is a description of professional assessment, not a checklist that turns an untrained reader into a forecaster. EAWS primary workflow.
Consider a fictional restaurant rating. The same overall score could combine excellent food with slow service, or adequate food with excellent service. The score cannot uniquely recover its ingredients. Compression makes comparison convenient while discarding distinctions that the underlying account preserves.
The practical editorial lesson is to preserve the explanation that accompanies the number. A headline can orient the reader, but an excerpt that omits the described problem, affected terrain categories, or relevant time period may remove the information that distinguishes one day from another. Reposting only a colored badge can therefore be less informative than it appears, even when the badge itself has been copied accurately.
This does not mean every reader must absorb a technical report before understanding that conditions warrant caution. Warning systems deliberately place concise information first. The problem arises when the concise layer is treated as the complete product. A well-designed hierarchy lets people recognize the broad message quickly and then find the details needed to understand its scope. The first layer and the deeper explanation should reinforce one another rather than compete.
The same principle applies when journalists compare forecasts. A change in the headline level may be newsworthy, but the accompanying explanation can reveal whether the important change concerns prevalence, instability, timing, or another aspect of the assessment. Reporting only that the number moved can hide the reason it moved. A more informative sentence identifies the change the issuing service actually described, without inventing a route-level implication.
Observations illuminate a landscape unevenly
A mountain region cannot usually be observed with equal detail at every point and moment. Some locations are accessible, some are visible from established observation sites, and some remain difficult to inspect. A forecast uses the evidence available, but the evidence has a geography of its own. Understanding that geography is part of understanding what an observation can establish about the wider region.
Schweizer and colleagues' 2021 study analyzed 589 expert field observations, mostly around Davos, collected over eighteen winter seasons. The proportion of profiles classified as poor or very poor increased across the assessed danger levels, but no single easily observed set of parameters fully characterized those levels. The authors highlighted the difficulty of representing spatial frequency from local instability observations. The study supports a relationship within its dataset while showing why a point observation does not automatically describe a region. Original field-observation study.
A simple hypothetical sampling example shows the general problem. Suppose a region contains many different terrain settings, but observations come mainly from a few convenient locations. Even precise observations from those locations may not represent the proportions of conditions across the entire region. Adding more measurements at the same locations can improve knowledge of those places without fully resolving the spatial gap. Sample size and representativeness answer related but different questions.
This distinction is important when a technology promises denser data. More observations can be valuable, but their contribution depends on what they measure and where they are available. A sensor network concentrated in one kind of location may improve temporal detail while leaving other settings poorly described. A remote measurement may cover a broad area but detect a different property from the one needed for a particular assessment. The relevant question is how the new information changes the inference, not simply how many additional data points it generates.
There is also a selection problem in human observations. People choose where to go, what to inspect, and what to report. Those choices may respond to the forecast itself. A dataset assembled from voluntary reports can therefore reflect both the underlying conditions and the behavior of observers. This is a general analytical possibility, not an allegation that any named study ignored it. The methods of a verification study need to explain how such limitations affect the conclusions it draws.
A public account can acknowledge these gaps without making the forecast sound useless. The right comparison is rarely between an imperfect warning and perfect knowledge. It is between the information available through a structured assessment and the information people would otherwise have. The existence of uncertainty is a reason to understand the warning's role and limitations, not a reason to replace it with a confident impression from a single photograph or anecdote.
An avalanche record is an observation record
A catalog of observed avalanches contains events that observers detected and recorded under particular conditions. It is not automatically a complete inventory of everything that happened. Visibility, access, timing, and the characteristics of the event can influence detection. A research conclusion based on a catalog should therefore be read alongside the methods used to assemble it and the limitations acknowledged by its authors.
A 2020 Davos study compared 13,918 visually observed avalanches with 3,533 danger ratings. Avalanche numbers increased strongly with danger level, while avalanche size did not generally increase in the same way. The authors also emphasized that visually observed records are inherently incomplete. Their result is a finding about the studied observations and warning categories, not a universal rule that event size never matters to danger assessment. Original occurrence study.
The general lesson is that counting events and describing their severity are separate tasks. A region with more recorded events can differ from one with fewer events in several ways. The events may differ in size, location, timing, and exposure to people or infrastructure. A single event count can be informative about activity while remaining insufficient for a broader statement about consequences.
This distinction becomes especially important when a forecast is judged after a quiet-looking day. An absence of recorded events can reflect genuinely limited activity, incomplete observation, or a combination. It does not automatically prove that a warning was unnecessary. Equally, the occurrence of an event somewhere within a region does not by itself prove that every detail of a warning was accurate. Verification needs a comparison aligned with what the forecast actually claimed.
Imagine a hypothetical forecast describing elevated potential across a broad region. If people avoid the relevant terrain and no human-triggered event is reported, the absence of an accident does not establish that the underlying potential was low. This is an explanatory counterfactual, not a claim about a particular outing or an invitation to test a slope. Warning systems influence behavior, so outcomes involving people cannot always be interpreted independently of the warning's effect.
For a journalist, this means resisting the temptation to evaluate a forecast with a single dramatic example. An event can illustrate a problem, but a systematic assessment requires the wider record and a clear definition of success. The most revealing reporting may concern how a service gathers and interprets evidence across many situations, including those that never produce an attention-grabbing photograph.
Verification is not a simple answer key
Forecast evaluation sounds straightforward when the predicted quantity can later be observed directly. Avalanche danger complicates that picture because the target is an assessment of potential across space and time. Researchers can compare forecasts with observed activity, local expert estimates, stability observations, or other information, but each comparison has its own scope. A verification statistic needs its reference stated as clearly as its numerator and denominator.
Techel and Schweizer's 2017 study examined nearly ten thousand local danger estimates from more than one hundred trained observers. Nearby observers sometimes disagreed, and agreement between local estimates and regional forecasts changed when uncertainty and reporting bias were considered. The reported agreement was seventy-six percent before those adjustments and seventy-one percent afterward. These are comparisons with local expert estimates, not proof that a uniquely observable true regional danger was known on every occasion. Original verification study.
A percentage labeled accuracy can conceal several choices. What counts as a match? Are all category disagreements treated equally? Does the reference describe the same region and time as the forecast? How are missing observations handled? Does the dataset contain the full range of conditions or mostly the more common categories? Without these details, two accuracy figures may look comparable while answering different questions.
A hypothetical example demonstrates the role of the category distribution. Suppose a dataset contains ninety ordinary-category cases and ten unusual-category cases. A system that always predicts the ordinary category would match ninety cases, producing ninety percent agreement. That arithmetic says nothing about whether the system can identify the unusual cases. The example is not an estimate of avalanche forecast skill; it explains why a high overall agreement can coexist with a serious weakness in a subset of situations.
A useful evaluation would therefore show how performance varies across relevant categories and conditions. It might also compare the system with a meaningful baseline rather than reporting agreement alone. The baseline should reflect the question under study, not be selected to make the forecast look impressive. The goal is to identify what the forecast contributes and where improvement would matter most.
Disagreement between experts deserves similarly careful treatment. It can indicate ambiguity in the evidence, differences in scale, variation in interpretation, or some combination. It should not be converted automatically into a claim that expertise has no value. Nor should it be hidden behind the authority of the institution. A credible evaluation makes the disagreement visible enough to study and explains what efforts are being made to reduce avoidable inconsistency.
Borders can reveal differences in communication
Mountain terrain crosses administrative boundaries, while warning services operate within institutions with their own regions, schedules, and practices. A traveler may encounter more than one product in the same broader mountain range. Consistency matters because a familiar number or color encourages the reader to assume a familiar meaning. Where that assumption is imperfect, the difference should become a subject of study rather than an invisible burden placed on the user.
Techel and colleagues' 2018 Alpine analysis examined 477 forecast days across four winters. It found lower agreement across national or forecasting-center boundaries than within them, and identified warning-region size as an important influence on summary statistics. The study concerned spatial consistency and bias in that historical dataset. It does not establish that every boundary difference was an error or that the same pattern persists unchanged today. Original cross-border study.
The distinction between consistency and correctness is crucial. Two services can agree and still share an error. They can disagree because they use different spatial units or because conditions genuinely differ across the boundary. A consistency analysis can identify patterns that deserve investigation, but it does not automatically provide the true answer at every location. Its value lies in making discrepancies systematic enough to examine.
A cartographic thought experiment makes the role of region size clearer. Imagine the same landscape divided first into a few large regions and then into many smaller ones. If a warning summarizes conditions within each region, changing the boundaries can change the pattern of displayed categories even if the underlying landscape is unchanged. The smaller units may reveal variation hidden inside a larger unit; they may also require sufficient evidence to justify the finer description. More detailed boundaries do not create information by themselves.
This matters when maps are combined into a single interface. A seamless visual layer can hide differences in how the original products were defined. The interface should preserve issuing authority, validity time, and the relevant scope rather than smoothing everything into an apparently uniform data surface. A clean design is useful only if it does not erase distinctions needed to interpret the information.
For institutional cooperation, the opportunity is concrete. Services can compare terminology, region definitions, workflows, and evaluation methods. The objective need not be identical wording in every language or identical categories across every border. It is a more coherent relationship between the assessment, the product, and the expectations of users who move between them. Research on inconsistency can help identify where harmonization would improve understanding.
More detail can help, if it is earned
A coarse scale inevitably leaves variation within categories. Adding a qualifier can communicate some of that variation, but additional symbols are useful only if they correspond to information the assessment can support. Otherwise, the display gains apparent precision without gaining predictive value. The challenge is to distinguish justified refinement from a more complicated presentation of the same uncertain knowledge.
A 2022 Swiss study examined sub-level qualifiers assigned relative to the five-level scale and compared them with observations and model-related evidence over five years. Higher sub-levels generally corresponded to more locations with poor stability and greater avalanche activity. The authors emphasized that the findings were specific to the Swiss forecasting setup studied. The result supports a particular refinement approach under its evidence and operational conditions, rather than a universal promise that more categories always improve warnings. Original sub-level study.
There are two separate questions in adding detail. Can forecasters assess it meaningfully? Can users interpret it correctly? Evidence for the first does not automatically answer the second. A refined assessment may contain useful information but require careful explanation in the public product. A symbol that experts understand consistently can still be misunderstood when copied into a small notification or stripped of its legend.
An original interface example helps make the distinction. Suppose a hypothetical application displays a main category with a plus sign. One reader interprets the sign as a forecast of worsening conditions; another interprets it as the upper part of the current category; a third thinks it means a higher confidence level. The same symbol has produced three different messages. The design problem is not solved merely because the underlying assessment used the qualifier correctly.
Testing comprehension should therefore examine what people infer, not only whether they notice the symbol. A survey that asks users to identify a color may miss the more important question of what they believe the color permits them to conclude. A usability study can ask participants to explain the scope, time, and meaning of a fictional warning without asking them to make real travel decisions. Such testing could reveal misunderstandings before the interface becomes part of an actual safety-related information environment.
The added detail should also survive redistribution. Screenshots, social posts, and third-party applications can detach a qualifier from its explanation. A warning service cannot control every reuse, but it can make the original meaning easy to find and clearly state how the information should be attributed. Developers who reuse the material inherit a responsibility to preserve its context rather than treating it as decorative data.
Time belongs beside the map
A warning is issued at a time and applies to a period. Those are different pieces of information. A screenshot can remain visually persuasive after the period has ended, especially if its date is cropped away or buried in small text. For a safety-related product, time should be part of the information's identity rather than an optional footer.
The distinction becomes clearer in a hypothetical archive. A forecast issued on one evening may describe the following day. An update issued later may revise that assessment. If a researcher downloads only the latest version, the archive may no longer show what users saw at the earlier decision point. Evaluating the service requires a record of versions, issue times, and validity periods, not merely a folder of maps labeled by calendar date.
This is also an important design consideration for offline access. A cached warning may be useful when connectivity is limited, but the interface should make its age and validity conspicuous. It should not quietly display an old product in a way that resembles a fresh update. The article does not prescribe a particular application architecture; the principle is that users should be able to recognize what information they actually have.
A notification has an additional challenge: brevity. It may be the first thing a person reads, and some people may read nothing else. The limited space should preserve the issuing service and the connection to the complete current product. An attention-grabbing phrase that drops the relevant region or period can increase engagement while weakening understanding. Safety communication should be evaluated on the quality of interpretation it supports, not simply on whether it attracts a click.
Historical reporting needs the same discipline. A story about a past incident should identify the warning available before the event rather than using a later update as though it had been available earlier. Otherwise, the account can distort both the decisions people faced and the performance of the warning service. Hindsight changes the information available to the reporter; it should not silently change the information attributed to people at the time.
Clear timestamps are therefore more than administrative tidiness. They make accountability possible. They allow a service to explain how an assessment developed, a researcher to evaluate the appropriate version, and a reader to distinguish live information from an example used in education. A warning graphic without its temporal context is missing part of its meaning.
The temptation to turn uncertainty into a decimal
Digital products make it easy to display additional digits. A developer can transform a category into a decimal, interpolate between regions, or combine several inputs into a score. None of those operations automatically creates a calibrated probability. The appearance of mathematical precision should follow the evidence and model definition, rather than lead them.
A hypothetical score of seventy-three out of one hundred illustrates the problem. Does it represent the probability of an avalanche somewhere in a region, the likelihood of triggering at a specified location, a ranking relative to historical conditions, or a proprietary combination of indicators? These interpretations differ dramatically. A score without a defined event, area, time, and method can invite users to supply their own meaning, often more confidently than the producer intended.
A probabilistic product would need to define what outcome its probability concerns and how its calibration was assessed. A ranking product would need to explain that rank is different from probability. A category refinement would need to preserve the meaning of the original category. Combining these forms of information without clear labels can create a visually sophisticated product that is conceptually less clear than the simpler warning it replaces.
This does not argue against computational tools. It argues for matching the output to the claim. A model can support forecasters, organize observations, or identify patterns worth examining without becoming an autonomous authority on an individual slope. Its usefulness can be assessed through the decisions and comparisons it improves. A marketing claim that it removes uncertainty should face a much stronger evidentiary test than a claim that it contributes useful information.
The distinction is especially relevant to generated explanations. A language system can produce fluent text around a category, but fluency does not verify that the text preserves the issuing service's scope and qualifications. An application that summarizes a bulletin should be checked for omissions, invented detail, and changes in meaning. It should not add route-level reassurance that the source never provided. This is an information-integrity issue, not an argument that every automated summary is necessarily wrong.
For an ordinary reader, a healthy question is simple: what does this extra precision mean, and where was that meaning established? If the answer is unclear, the additional number should not be treated as a stronger warning product merely because it looks more technical. Transparency about a useful limitation is more informative than an unexplained decimal.
Reading a warning as a public information service
Avalanche warnings sit at the intersection of observation, professional judgment, and communication. Their public value depends on more than the quality of a model or the experience of one forecaster. It also depends on whether observations arrive, whether the workflow is maintained, whether updates reach people, and whether the product's limitations remain visible when it is reused.
An institution evaluating that service could distinguish several layers of performance. Was the relevant information available to the forecasting team? Was the assessment produced according to its intended process? Was the product issued and updated correctly? Did the public receive the version the service intended to communicate? Did users understand its broad meaning and scope? A failure at one layer can undermine the service even if another layer performed well.
These questions suggest a richer accountability record than a single accuracy percentage. A service might improve dissemination while still working on spatial consistency. It might gain a new observation stream while needing to study how much that stream changes assessments. It might discover a recurring misunderstanding in the public interface. Reporting such developments specifically allows progress to be recognized without pretending that one improvement solves every part of the problem.
The record should also make room for near misses in communication: outdated images circulated as current, incomplete excerpts, or applications that display a warning without its explanation. These events may not correspond to a documented accident, but they can reveal weaknesses in the information pathway. Studying them can support improvement without requiring a harmful outcome before a problem is taken seriously.
For readers, the result is a more realistic form of trust. Trust does not require imagining that a regional forecast knows the condition of every slope. It can rest on a service that explains what it assesses, maintains a traceable process, studies its errors and disagreements, and communicates the boundaries of its product. That kind of trust is compatible with uncertainty because it is built around how uncertainty is handled.
How to ask whether a new warning display helps
Suppose a research team proposes a new way to display the same official information. The appropriate evaluation would begin by identifying the intended improvement. Is the aim faster recognition of the relevant region, better understanding of the validity period, fewer mistaken interpretations of a qualifier, or easier access to the complete explanation? A design cannot be judged meaningfully until the outcome is specified.
A hypothetical comparison could show participants two fictionalized displays containing equivalent information. The researchers could ask what period each display covers, which authority issued it, and whether it refers to a region or an individual location. They could record errors as well as response time. A faster answer is not necessarily better if it is more often wrong. The evaluation should preserve that distinction rather than combining speed and correctness into an unexplained score.
Participants would also need to represent the intended audience. A display that works well for specialists may rely on conventions unfamiliar to occasional readers. A display tested only on large monitors may behave differently on a small screen. Translation, color perception, and access to explanatory text can affect interpretation. These are design questions that can be investigated without asking participants to expose themselves to actual avalanche terrain.
The study should distinguish recognition from reasoning. Someone may correctly name the category while still believing it certifies a nearby slope. Another person may recognize the date but confuse issue time with validity time. Asking participants to explain the message in their own words can reveal misunderstandings that a multiple-choice label test misses. The point is to understand the mental model the interface creates, not merely whether people can repeat its most visible symbol.
A useful result might be mixed. One design could improve time recognition while making the issuing authority less obvious. Another could communicate the qualifier clearly but overwhelm readers with too much competing information. The team would then have a concrete basis for revision. Declaring one design universally superior from a narrow test would exceed what the evidence supports.
Finally, the evaluation should document the exact version tested. Small changes in label placement, contrast, or wording can alter the information people notice. If a revised product is released, the earlier study should not be cited as though it automatically validated every later modification. Preserving screenshots, task wording, and the analysis plan makes the result useful to future designers and allows readers to see what was actually assessed.
This approach treats communication as a component of the warning system that deserves evidence. It avoids the assumption that a more polished interface must be a better one, while leaving room for genuine improvements. The measure of success is whether people understand the intended message more accurately within its proper scope. In a safety-related setting, that is a more meaningful ambition than making an uncertain situation look deceptively simple.
The useful meaning of the number
The headline category remains valuable. It gives a shared language to a complex and changing situation. Its usefulness grows when the reader understands what has been compressed and knows where to find the rest of the explanation. The number should orient attention toward the complete current warning, not replace it with a private arithmetic of acceptable risk.
The research discussed here shows several reasons to be precise. Local observations do not automatically represent a region. Observed events do not form a perfect census. Expert estimates can disagree. Administrative boundaries and region sizes can influence displayed patterns. Additional qualifiers can contain information when the assessment and communication support them. None of these findings turns the warning into a guarantee or an empty gesture.
A responsible public-interest account therefore leaves readers with better questions rather than a homemade decision rule. Which service issued the product? What region and period does it cover? What does its explanation say beyond the category? What kind of evidence supports a claim about its quality? And does a third-party display preserve the original meaning? For actual mountain decisions, the current official bulletin, local conditions, and appropriate professional education remain essential; this article supplies no clearance for a route or slope.
The colored number is most useful when it is understood as the entrance to an assessment. Behind it are people, observations, models, definitions, and a continuing effort to compare predictions with an imperfectly observed world. Seeing that work does not weaken the warning. It makes its proper role clearer, and makes careless claims of certainty easier to recognize.