
New Klamath and Elwha research separates rapid fish passage, moving sediment, and the slower work of ecological recovery.
The dramatic image of dam removal is a river passing through a place where concrete used to stand. The engineering obstruction has gone. Water is moving. The photograph supplies a satisfying ending, but it catches the beginning of several different stories. Fish may explore newly accessible reaches. Sediment may move through the channel in uneven pulses. The riverbed may rearrange. Organisms that live among its particles may change in abundance and identity. Calling all of this recovery without specifying the measurement makes the story easier to tell and harder to understand.
Two studies published in 2026 sharpen the distinction. An August Klamath study used imaging sonar to estimate adult Chinook passage into reopened reaches during the first two migratory seasons after four dams were removed. It estimated 7,742 fish in 2024 and 13,310 in 2025, with reported ninety-five percent confidence intervals of 7,702–7,778 and 12,876–13,733 respectively. The researchers documented rapid recolonization across 345 kilometers of reconnected habitat. These are important observations of passage and distribution; they do not by themselves establish the long-term production of self-sustaining populations. USGS record of the original study, August 27, 2026.
An October Elwha paper examined nine years of benthic macroinvertebrate monitoring. During active removal, density declined by as much as ninety-five percent in affected reaches, then approached baseline within three years after peak sediment transport subsided. Taxonomic richness and community composition remained altered. The study therefore distinguished numerical recovery from a return to the earlier ecological community. That contrast is useful precisely because the same river can support different answers depending on which biological question is asked. Original study, October 2026.
The emerging lesson is neither an instant success story nor a reason to assume restoration cannot work. It is a way of reading change at the correct scale. A barrier can be removed on a construction schedule. A river responds through connected physical and biological processes whose clocks differ. This article follows those clocks, explains the measurements behind them, and develops original questions for evaluating a removal project without turning either its early disruption or its early gains into a final verdict.
The opening is an event; the response is a sequence
A removal date is useful administrative information. It tells a historian when a particular structure ceased to occupy the channel in its former configuration. It may also mark a change in the conditions available to fish or flowing water. It does not automatically identify the start of every downstream response. Reservoir drawdown, partial dismantling, and changes in sediment transport can occur over an interval. A study that compares before and after needs to explain which part of that interval defines its comparison.
Imagine an entirely hypothetical project with three stages: initial drawdown, a partially opened channel, and final removal of remaining infrastructure. A water-quality instrument downstream might detect a change during the first stage. A fish survey might first observe passage during the second. A photographic record might label the third as the project's completion. None of the records has to be wrong. Confusion arises when their dates are treated as interchangeable, especially if one is used to calculate the time required for another outcome.
The sequence also affects the language of causation. An observed change after a project is relevant evidence, but its timing alone does not identify the mechanism. A fish count can change with the number of fish arriving at the river, their distribution within it, and the ability of a method to detect them. A sediment measurement can change with flow conditions as well as the supply of material. A careful explanation asks how the intervention and the surrounding conditions jointly produced the observation.
For public reporting, a small timeline can be more informative than a large celebratory number. It can distinguish the engineering stages, the observation periods, and the dates on which results were published. That last distinction matters because a paper released in a particular year may analyze observations collected much earlier. Readers should not infer that every condition described in a newly published paper is a live report from the river on publication day.
This is particularly important when an article compares projects. Two years after the beginning of dismantling at one site may represent a different stage from two years after complete removal at another. A comparison of recovery rates should align the underlying events rather than matching calendar labels casually. Without that alignment, a faster-looking response may partly reflect where the analyst chose to start the clock.
The issue is broader than semantics. Funding, monitoring, and public expectations often follow the construction schedule. If the evaluation period ends when the contractor leaves, it can miss the processes that justify the intervention in the first place. Conversely, if early changes were not observed because monitoring began too late, later researchers may struggle to reconstruct how the system reached its new condition. The observation schedule belongs inside the project design, not merely in its retrospective publicity.
Follow the sediment from its source
A reservoir can contain a store of sediment accumulated over time. Once water levels and barriers change, the question becomes where that material goes, how quickly it moves, and what it encounters along the route. Saying that sediment is released is only the opening of a budget. Some material may remain in the former reservoir area; some may be stored farther downstream; some may pass beyond the area surveyed. A useful account keeps those compartments separate.
Ritchie and colleagues' 2018 Elwha study constructed a five-year source-to-sink sediment budget for water years 2012–2016. It estimated that about sixty-five percent of the sediment initially impounded in the reservoirs had been exported from them. Of the combined supply from reservoirs and upstream watershed, about ten percent was deposited in the river channel and floodplain, twenty-six percent in the surveyed coastal delta area, and the remainder transported beyond the coastal survey boundary. Those percentages use different denominators from the initial reservoir-export percentage. Original five-year study.
The denominator deserves attention because sediment stories often mix stocks and flows. A stock is the quantity present within a defined compartment at a given time. A flow is the quantity crossing a boundary over an interval. A share of the original reservoir stock is different from a share of all material supplied during a monitoring period. If an article combines those percentages without identifying the boundaries, the numbers can appear contradictory even when the underlying accounting is consistent.
Consider a simplified invented example. A former reservoir contains one hundred units of material. Forty units leave during the observation period, while the upstream watershed contributes another ten units. If five units are stored in a downstream reach, that is five percent of the original reservoir stock but ten percent of the fifty units supplied to the downstream system. Both statements can be arithmetically correct. They answer different questions, and the second additionally depends on whether all fifty units crossed the relevant boundary.
The units require similar care. Sediment volume and sediment mass are not interchangeable without information about density and what the measurement includes. A number in cubic meters should not be compared directly with a number in tonnes as though a larger numeral means more material. An account may also distinguish dry sediment from material containing water and pore space. A transparent report keeps the original units and explains any conversion rather than silently translating everything into a visually convenient total.
A budget is valuable even when it contains uncertainty. Survey differences, sampling limitations, and unmeasured transport can leave a residual. The appropriate response is to show how that residual was estimated or interpreted. A perfectly tidy graphic can be less honest than a budget that identifies a poorly constrained compartment. What matters is whether readers can see which pathways were measured, which were inferred, and how much uncertainty remains around each.
The coast is part of the river story
A downstream boundary drawn at the river mouth can hide a substantial part of the response. Material that leaves a river channel can influence a nearby coastal environment, but its distribution need not match the outline of the river's plume in a single photograph. Different materials can follow different pathways, and the area covered by a survey constrains what can be concluded from it. A river-restoration story becomes more complete when it follows the material beyond the convenient end of a map.
Gelfenbaum and colleagues' 2015 study examined coastal geomorphic change during the first two years of Elwha dam removal. The researchers documented substantial deposition near the mouth and differences in the retention and dispersal of sediment classes. Their analysis covered a particular coastal survey domain and observation interval. It provides evidence of a coastal response, rather than a claim that every particle released from the reservoirs remained at the delta. Original coastal study manuscript.
The analytical lesson is to distinguish arrival from retention. A particle can cross a river mouth, spend time in a nearshore area, and later leave the survey domain. A measurement of deposition at one date captures the balance of arrivals and departures up to that point. It does not necessarily describe the total quantity that passed through. This distinction is useful whenever a project is credited with rebuilding a coastal feature: the relevant evidence concerns both the source and the resulting change in the feature over time.
Photographs can make this difficult. An obvious new deposit may be compelling evidence that the landscape changed, but its appearance does not provide a complete sediment budget. A broad shallow deposit and a smaller thick deposit can contain different quantities than their visible areas suggest. Water level, lighting, and camera angle can further alter their apparent extent. A surveyed surface change and a photograph have different evidentiary roles even when both are accurate representations of the same place.
The coastal connection also complicates simple classifications of sediment as either beneficial or harmful. The significance of material depends on where it arrives, in what form, at what rate, and for which organisms or human uses. A narrative that treats all sediment movement as contamination misses the physical role of sediment in landscapes. A narrative that calls every sediment pulse beneficial ignores the possibility of disruptive conditions along the route. The task is to identify the relevant process and outcome rather than attach one permanent moral label to the material.
For a project evaluation, this suggests a spatial sequence of questions. What left the former reservoir? What changed in the river? What crossed the mouth? What remained within the surveyed coastal area? What ecological or practical outcomes were measured there? Each question can be answered with different methods. Keeping them linked without collapsing them into a single success indicator gives a clearer account of what the intervention changed.
A fish above the former dam answers one question
Seeing a fish in previously inaccessible habitat is powerful evidence of access. It may also carry cultural and personal significance that a count cannot fully capture. Scientifically, however, access is the beginning of a demographic question. A population's long-term condition involves more than the presence of adults in a new reach. An assessment should distinguish the observation that fish arrived from the subsequent questions about reproduction, juvenile survival, movement, and future returns.
Duda and colleagues compared extensive Elwha snorkel surveys conducted before removal in 2007–2008 with surveys in 2018–2019. Their 2021 paper documented spatial changes in fish distributions, including substantial upstream extensions for adult Chinook salmon and summer steelhead. The design speaks directly to where fish were observed across the surveyed river. Its value does not require treating expanded distribution as a complete measure of every population's recovery. Original spatial-response study.
An original way to organize the questions is to separate a ladder of outcomes. The first rung is physical connection. The next is observed passage. Another is use of the newly connected habitat. Further rungs concern successful reproduction and the contribution of later generations. This ladder is an explanatory framework, not a universal biological sequence that every species must follow identically. Its purpose is to prevent a result on one rung from being advertised as though it measured all the others.
The distinction becomes important when a headline compares counts across two years. A higher number in the later year may be encouraging, but the interpretation depends on what was counted and the conditions under which fish reached the observation point. A passage estimate is not automatically a count of distinct successful spawners, and a count of spawners is not automatically a measure of offspring that survive to return. Methods and definitions provide the bridge between the numerical result and the biological claim.
Uncertainty intervals help describe the precision of an estimate within its method. They do not automatically include every uncertainty in a broader causal interpretation. A narrow interval around a passage count can coexist with substantial uncertainty about future population performance. That is not a defect in the count. It means the observation answers a narrower question than the one a reader may be tempted to ask of it.
The cultural meaning of a return should not be reduced to that methodological distinction. People can rightly regard renewed access as a major event without claiming it settles every scientific question. Reporting can respect both levels: explain why the observation matters to communities and state exactly what the research measured. There is no need to inflate the demographic conclusion in order to acknowledge the significance of the event.
Density, diversity, and identity can move differently
Imagine two hypothetical samples from a riverbed. Each contains one hundred organisms. The first contains many kinds distributed fairly evenly; the second is dominated by a few kinds. Their total abundance is identical, but their composition differs. Now imagine a third sample with fewer organisms but more kinds. No single number can summarize all of these contrasts. An evaluation that chooses only abundance may miss a change that becomes obvious when taxonomic identity is considered.
This distinction is especially important when discussing a return to baseline. A baseline is a reference condition established by particular observations, at particular places and times. Returning to its numerical range does not necessarily mean the system has recreated every feature of that earlier state. Conversely, a different composition does not by itself identify whether the new state is preferable for every ecological or social objective. The interpretation depends on the question and the evidence available.
A project team should therefore explain why it selected its biological indicators. If the objective concerns the food available to fish, the relevant measurements may differ from those used to characterize the full benthic community. If the objective concerns habitat connectivity, a distribution measure may be especially informative. If the objective concerns the persistence of particular species, total abundance across all species could conceal the outcome of greatest interest. Indicator choice is a substantive scientific and policy decision.
Sampling design further shapes what an indicator can reveal. A survey conducted in one season may not be directly comparable with a survey conducted in another. A change in the area sampled or the effort devoted to identification can alter the apparent number of kinds present. A good report describes those choices so that readers can distinguish ecological change from a change in observation. This does not require every public summary to reproduce a laboratory manual; it requires the summary to retain the qualifications essential to its main conclusion.
An honest recovery dashboard could show several indicators side by side without forcing them into a single score. One might improve quickly, another remain altered, and a third remain too uncertain for a conclusion. That pattern can guide further work. A composite score that averages the differences away may be easier to promote but less useful for understanding what the river is doing.
There is also a time-horizon issue. An indicator may appear stable over a short period and change again later. Declaring a final endpoint too early can conceal that possibility, while refusing to recognize any progress until every indicator stabilizes can make meaningful gains invisible. The sensible middle ground is dated, indicator-specific reporting: describe the observed condition during the study interval and distinguish it from an expectation about the future.
Water quality requires more than the color of water
Muddy water invites immediate interpretation because its appearance is so obvious. Yet color alone does not specify the concentration of suspended sediment, its composition, the duration of exposure, or the conditions affecting a particular use. A photograph can document that the water looked different. It cannot replace the sampling and analytical methods needed to answer more specific questions. This is a general measurement distinction, not a claim that visual observations have no value.
The USGS Klamath dam-removal program describes a monitoring approach combining continuous and discrete observations, including sediment and water-quality work at multiple river locations. Its program material contains both monitoring descriptions and earlier predictions. Those should be read separately: an expected export fraction in planning material is not automatically a measured post-removal result. The program's value here is its account of how observations are organized across space and time. Primary monitoring-program record.
The distinction between a continuously recorded proxy and a laboratory measurement is useful for readers. A sensor can provide frequent information about a property it detects, while a collected sample can support a different kind of analysis. Relating the two may require calibration and assumptions. A dense time series is not automatically a direct measurement of every substance of concern. Conversely, a carefully analyzed sample is still a sample from a particular place and time rather than a complete record of all conditions.
An invented example illustrates the problem. Suppose a river is sampled once during a month, and the result is within a selected comparison range. That observation cannot alone establish that the same condition held during every hour of the month. Suppose instead that a sensor records a spike but no matching sample is collected. The spike may be important, but the sensor's measurement does not automatically identify every constituent responsible for it. A useful monitoring plan anticipates how the different observations will be interpreted together.
The California State Water Board's March 26, 2024 Klamath FAQ described required continuous monitoring, water-column grab samples, and sediment samples, while discussing anticipated short-term effects and longer-term objectives. It is a dated regulatory account from the removal period, not a present-day certification of water conditions. Its forecasts and preliminary observations should retain that date whenever quoted. Official 2024 record.
For readers, the safest interpretation of a historical water-quality document is also the most accurate one: it tells you what the document's authors reported or expected at that time. It should not be repurposed as current advice about drinking, swimming, fishing, or another specific use. Those decisions require the relevant current authorities and conditions. An article about restoration evidence can explain the monitoring logic without pretending to issue a local health or safety clearance.
Comparing rivers without pretending they are replicas
The Elwha and Klamath provide valuable opportunities to learn, but they are not duplicate experiments. A transferable lesson may concern a measurement approach or a distinction between outcomes rather than a numerical prediction. The fact that one river showed a particular trajectory does not establish that another will follow the same timetable. The task is to identify which features of the comparison are sufficiently similar to support the inference being made.
A useful comparison begins with a question rather than a resemblance. If the question concerns how to measure fish passage, methods from another river may be informative even when the river's physical setting differs. If the question concerns the fraction of stored sediment likely to leave a reservoir, differences in material, geometry, flow, and removal sequence may be central. The same pair of projects can be comparable for one purpose and poorly matched for another.
This distinction can prevent both overconfidence and unnecessary isolation. It would be wasteful to treat every project as though nobody had ever observed a river respond to removal. It would be equally unhelpful to turn the best-studied project into a universal template. Learning involves identifying mechanisms, testing their relevance, and retaining the differences that could change the outcome. A case study contributes most when its boundaries are visible.
An original comparison worksheet could contain four columns: the question, the observed result elsewhere, the features that make it relevant locally, and the features that limit transfer. For example, a finding about the value of repeated spatial surveys could transfer more readily than a specific percentage change in a biological indicator. The worksheet would not generate a decision automatically. It would make the reasoning available for discussion and correction.
The same discipline applies to the phrase largest dam removal. A project can be largest by height, number of structures, sediment volume, connected habitat, or another measure. Those descriptions can all be meaningful if their metric is stated. They should not be used as a shorthand for the greatest ecological benefit or the strongest evidence. Scale affects the questions a project raises; it does not replace the measurements needed to answer them.
For public-interest reporting, this is an opportunity to move beyond a contest of superlatives. The more revealing story may concern an improved observation method, a result that differs across indicators, or a mismatch between a forecast and a measured response. Such findings help future projects even when they do not fit a simple record-breaking narrative. They show how knowledge accumulates through comparisons that preserve rather than erase context.
Who chooses the reference river?
Recovery language often implies that there is one obvious earlier condition to which a river should return. In practice, selecting a reference condition involves scientific evidence and human objectives. A river before construction, a river immediately before removal, and a plausible future river under changing conditions are different reference points. A project can move away from one while moving toward another. An assessment should name the comparison rather than hiding it inside the word natural.
The immediately pre-removal condition is useful because it may have been measured directly. It can support a clear before-and-after comparison. But it is also the condition shaped by the dam and other influences present at that time. Returning every indicator to that baseline would not necessarily describe the intended outcome of removing the dam. The baseline is an observational reference, not automatically the desired endpoint.
A historical reference can provide another perspective, but its evidence may differ in precision and coverage. Written records, physical traces, surveys, and community knowledge can contribute different kinds of information. They should be attributed and interpreted according to what they establish. A broad historical description of fish presence is not equivalent to a modern estimate produced by a specified counting method, even when both are valuable.
Future objectives introduce a further question: what functions and relationships should the project support under conditions that may differ from the past? That question cannot be answered by a single historical photograph. It requires a discussion of ecological aims, cultural priorities, water uses, and practical responsibilities. Scientific observations can inform the options and their consequences, while the choice of objectives remains a decision that should be visible to the people affected.
Indigenous nations and local communities should not appear only as decorative quotations after the technical account is complete. Their relationship to the river can shape the purpose of restoration, the questions worth asking, and the legitimacy of the decision process. This article does not invent statements or preferences for any nation or community. The reporting principle is to seek and attribute those positions directly rather than assuming that one institutional account speaks for everyone.
Disagreement should be described with similar precision. People may agree that fish access improved while disagreeing about other consequences or priorities. They may support removal while criticizing a monitoring gap. Treating every concern as opposition, or every positive observation as endorsement of all project decisions, flattens the discussion. A useful account separates the empirical claim from the judgment being made about it.
A recovery report that people could actually use
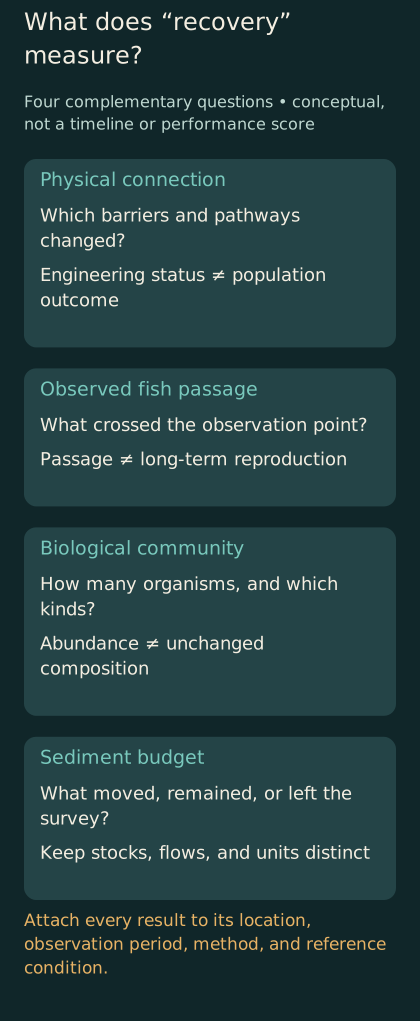
Conceptual comparison of four evaluation questions. The panels are not a recovery timeline, causal proof, or a numerical score.
Imagine a hypothetical annual report designed for residents, researchers, and decision-makers rather than for a launch event. Its opening page would state the observation period and the outcomes being tracked. It would distinguish completed engineering work from ongoing ecological assessment. It would identify which results are new, which are revisions, and which questions remain unanswered because the relevant observations are not yet available.
The next part could follow the river spatially. A map would identify former reservoirs, monitoring reaches, passage observation points, and the coastal survey area where relevant. Each result would be attached to its location and period. This would prevent a local measurement from quietly becoming a statement about the whole basin. It would also show where the observation network has gaps.
A physical-results section could separate water conditions, sediment transport, and changes in channel form. A biological section could distinguish passage, distribution, abundance, and community composition. The categories would not imply that these processes are independent. They would make their relationships easier to discuss without confusing their units or treating improvement in one as proof of improvement in all.
The report should explain changes in methods. If a counting system was replaced, a survey area expanded, or a sample-processing procedure changed, the comparison should account for that transition. A new method may improve the evidence while complicating a trend. Concealing the change to preserve a smooth graph would sacrifice the very information readers need to interpret the result.
Uncertainty should be attached to the relevant quantity rather than relegated to a vague closing disclaimer. A confidence interval around a count, a range for a sediment estimate, and a qualitative gap in observation are different forms of uncertainty. They should not be collapsed into one universal caution symbol. Readers can handle complexity when it is organized around the questions they are trying to answer.
Finally, the report should connect observations to decisions. Which findings change the monitoring plan? Which require further investigation? Which support continuing the existing approach? Which concerns remain outside the scope of the data? This is where a restoration program demonstrates that monitoring is more than a ceremonial requirement. Evidence becomes useful when somebody has the responsibility and capacity to act on what it shows.
The missing comparison is often the hardest one
A removal project changes a river once. Researchers cannot usually repeat the same river's history with the dam left in place and compare the two versions directly. That makes the counterfactual important: what would have happened during the observation period without removal? The question does not diminish the value of measurements. It clarifies why a well-documented change and a complete causal explanation are different achievements.
Consider a hypothetical fish count that rises after removal during a period when counts also rise elsewhere in the basin. The local increase may reflect newly available access, a broader increase in returning fish, or both. A comparison with other observations can help distinguish these possibilities, but the comparison needs its own justification. A neighboring reach is not automatically an equivalent control if its habitat, observation method, or exposure to other changes differs.
The same issue appears in sediment interpretation. A wet year and a dry year offer different transport conditions. If an analysis compares them without accounting for that difference, it may attribute too much of the change to the intervention or overlook a response that occurred despite relatively limited transport opportunities. A useful report explains how the observation period relates to the river conditions during that period, rather than allowing the calendar alone to stand in for the physical context.
One way to strengthen interpretation is to combine several lines of evidence that address the same mechanism from different directions. A spatial pattern, a time series, a measured change in the physical environment, and a model can inform one another. Agreement is more persuasive when the methods have genuinely different limitations. Repeating the same underlying estimate in several charts does not provide independent corroboration simply because the displays look different.
Disagreement can also be informative. If a model predicted one pattern and observations show another, the mismatch identifies something worth examining. The response might involve revising an assumption, investigating a missing process, or discovering a limitation in the measurements. Automatically treating a mismatch as either total model failure or irrelevant noise prevents learning. The useful question is which part of the explanation the new evidence challenges.
For journalists and readers, this suggests a practical distinction between a claim of contribution and a claim of exclusive cause. Evidence can support the conclusion that removal enabled a particular pathway without establishing that it alone explains every subsequent change in a population or landscape. Keeping that distinction visible allows a strong finding to remain strong without attaching unsupported explanations to it.
What completion should mean for the public record
A project can be complete as a construction contract while its scientific evaluation remains active. Those are legitimate but different statuses. A public archive should preserve both. It should say when the physical work ended, what monitoring continued, and which obligations were transferred to another organization. Otherwise, the disappearance of a contractor can be mistaken for the end of responsibility for understanding the river's response.
The archive should also retain unsuccessful measurements and acknowledged limitations. A failed instrument, an inaccessible survey site, or an interrupted sampling series can explain why a conclusion remains uncertain. Omitting these details may make the record look cleaner while making later interpretation worse. Future researchers need to know whether a blank period means no change, no sampling, or a problem with the observation system.
A durable record is especially valuable when public debate returns years later. The original reports, data definitions, maps, and method changes allow people to revisit claims without depending on a fading memory of the launch. New analysis can then build on a traceable history rather than rediscovering the same ambiguities. That continuity is part of the practical value of monitoring: it preserves the ability to ask better questions after the immediate controversy or celebration has passed.
Progress without a premature ending
A river after dam removal can produce encouraging and disruptive observations at the same time. That coexistence is not a contradiction. Different parts of the system respond to different aspects of the intervention, and the measurements describe different outcomes. The challenge is to retain those distinctions long enough to learn from them rather than selecting only the result that fits a preferred verdict.
For a reader encountering the next headline, a compact set of questions can help. What was actually measured? Over what interval and geographical area? Which comparison defines improvement? Does the result concern access, abundance, composition, or a physical process? And what additional evidence would be needed to support the larger claim being made around it? These are tools for reading research, not a formula for deciding the fate of a particular dam.
The most useful ending to a removal story may therefore remain open. The obstruction is gone, and some important changes can already be observed. Other outcomes need longer records or different measurements. Describing that distinction clearly gives early gains their proper weight without asking them to carry the entire future of the river. It also leaves room for the evidence to surprise the people who worked hardest to make the project happen.