The useful answer starts with waves, water depth, and the landscape behind the trees—not a universal strip width.
A line of trees can look remarkably like a line of defense on a planning map. Draw a green ribbon along the shore, label its width, and the promise seems understandable: waves arrive from the sea, encounter roots and trunks, and reach the settlement with less force. That picture contains an important physical mechanism. It also leaves out most of the questions that determine whether a coastal protection project will work.
Which waves? At what water level? Across which mudflat? Through a healthy mature stand or a newly planted plot? And what does protection mean for the people behind it: less erosion, fewer broken windows, a lower chance of a flooded road, or a reliable evacuation route during a severe cyclone? These outcomes share a coastline, but they do not share a single measurement. An article that gives one percentage without naming the outcome can make a modest, useful result sound like a comprehensive safety guarantee.
A study published in April 2025 offers a timely example. Van Wesenbeeck and colleagues ran 216,000 numerical simulations to examine uncertainty in wave attenuation across mangrove settings. Their modeled tidal flats accounted for more than half of incoming wave-height attenuation, and wider forests generally provided stronger reductions. The paper's tested wave conditions did not establish performance against storm surge, infragravity waves, typhoon conditions, or tree failure. A May correction repaired figure legends and a figure title, restored a data link, and added missing supplementary sources; the corrected publication is the version used here. Study, correction.
The practical question is therefore richer than whether mangroves work. It is how to turn a living, changing coastal landscape into an honest protection claim. This article separates the observations, experiments, and models that inform that claim, then develops an original decision framework for reading a proposed project. The illustrative calculations and planning examples below are hypothetical, not measurements from a named village or recommendations for designing a real coastal defense.
Start with the thing being reduced
Imagine standing beside a shallow channel and watching a floating leaf rise and fall. The repeated motion gives one sense of a wave. Now imagine the entire channel gradually filling as the tide rises. Both processes change where the leaf sits, but a reduction in its rapid up-and-down motion does not necessarily mean the channel's slowly changing water level has fallen. A diagram of smaller ripples behind trees should never silently become a diagram of dry houses during an elevated coastal water level.
Wave height describes a vertical distance between a crest and a trough. Wave energy describes something different. For an idealized comparison with other relevant conditions held equal, energy scales with the square of wave height. If a hypothetical wave height falls from one unit to six tenths of a unit, the corresponding energy ratio is thirty-six hundredths. That is a forty percent height reduction and a sixty-four percent energy reduction. Both figures can describe the same hypothetical change, and neither is a measured result for a particular forest.
This elementary distinction is especially important when reading attractive summaries. A project brochure might borrow a percentage from a paper and replace the word energy with height. That substitution changes the claimed physical performance. Another brochure might preserve the word energy but omit the distance over which the change was measured. A third might report a result from relatively shallow water as though it applied at every tide. Each version can be assembled from individually plausible words while giving the reader a substantially different impression.
A sensible claim therefore needs a short grammatical structure: a named quantity changed by a stated amount, between identified locations, under specified conditions. For example, a monitoring report could describe a change in a defined wave statistic between an offshore station and a station within a forest during a particular observation period. That sentence does not need promotional adjectives. Its strength comes from making comparison possible. A later observer can ask whether the same quantity was measured with comparable instruments and whether the conditions were similar enough to learn from the difference.
Consider how much more work the phrase coastal protection must do. A lower wave height near a road may reduce one kind of loading while water still reaches the road through a creek. A property can experience less wave action while its floor remains below the high water level. A shoreline can retain a useful buffer while an exposed access path remains hazardous. These are conceptual possibilities, not claims that a particular surveyed site experienced them. They explain why a project should name the service it intends to provide before selecting the measurements that will advertise success.
The distinction also improves public communication. Residents need to know whether a project aims to make routine conditions gentler, reduce the impact of a rarer event, slow the loss of land, or support several objectives with different confidence levels. Treating every benefit as the same kind of safety creates a brittle promise. Giving each benefit its own evidence and operating conditions creates room for success that is both meaningful and limited.
A forest is a three-dimensional obstruction
From above, two mangrove stands may have similar green canopies. Water approaching them does not interact with an aerial photograph. It encounters a changing arrangement of roots, stems, gaps, and submerged surfaces. The amount and placement of plant material in the water matter to the forces exchanged between the flow and the vegetation. A plan based only on canopy area risks missing the part of the forest most relevant to its intended hydraulic role.
One original experiment makes the measurement problem unusually clear, although it studied willows rather than mangroves. Kalloe and colleagues compared manual measurement, terrestrial laser scanning, and geometric approaches to describing vegetation frontal area. Laser shadowing could underestimate that area, and the different approaches produced different inferred drag coefficients. Published in March 2022, the work is useful here as a measurement lesson, not as direct evidence of mangrove performance. Original experiment.
The broader analytical point is about the relationship between a parameter and the way it was obtained. Suppose an analyst adjusts a resistance coefficient until a model reproduces an observed wave change. If the vegetation area used in that model is underestimated, the fitted resistance may compensate. Reusing that fitted coefficient with a more complete area estimate at another site could count some resistance twice. This hypothetical example illustrates why a calibrated number cannot always travel independently of the measurement convention that produced it.
Water depth adds another dimension. A root system that occupies a substantial fraction of a shallow water column presents a different arrangement to moving water than the same system beneath a much deeper column. The relevant geometry changes without a single tree moving. That observation should make us suspicious of project comparisons that match forest width but ignore the levels at which performance was assessed. A forest's protective role needs to be described over a range of water conditions, not only at the moment when the roots are most photogenic.
A 2026 modeling preprint by Pang and Tay examines root morphology and sea-level rise in wave attenuation. The abstract of its August revision describes a non-monotonic dependence on wave frequency and a depth-to-root-height condition under which rising water can enhance attenuation. It remains a preprint, and only its abstract was used here. Its contribution to this discussion is a research question about vertical structure, not a validated design rule for any community. Preprint, revised August 2026.
For a planning team, the implication is to retain the geometry in the description. A useful site record could distinguish the plant structures visible at different elevations, the distribution of open channels, and the portions of a transect that contain little vegetation. Such a record would let an engineer or ecologist understand what the site description leaves unresolved. A single label such as dense forest can hide several configurations that might behave differently.
There is a communication benefit as well. Showing the waterline at more than one level on a conceptual cross-section is often more informative than adding another green icon to a map. It makes clear that width, depth, and structure interact. It also discourages the assumption that an increase in sea level simply subtracts a fixed percentage from an otherwise unchanged protection service. Changes in a living shoreline can involve geometry, ecology, and land use together, which is why a linear slogan is an inadequate substitute for a site assessment.
What a field transect can tell you
Field measurements anchor the discussion in actual water and vegetation. Horstman and colleagues reported observations from two contrasting mangrove transects in Trang, Thailand, in a 2012 conference paper. Their results included a sixty-three percent reduction in incident wave energy over a 246-meter transect at Kantang and a seventy-two percent reduction over a ninety-eight-meter transect at Palian. The sites differed in vegetation and wave conditions; the results are not interchangeable rates per meter. The measured quantity in those comparisons was energy, an important detail when quoting them. Field study.
An appealing but unsound shortcut would divide each reported reduction by its transect length and announce which forest was more efficient. That arithmetic would produce a number, but it would discard the conditions that made each observation meaningful. It would also imply a constant rate of reduction along the entire route. In a system with changing depth, vegetation, and incoming conditions, a single average can be useful for describing an observation without becoming a transferable physical law.
A better way to read a transect is as a sequence of locations through a particular landscape. Where was the first instrument? What lay between it and the first roots? Did the route cross a channel or a patch of open ground? Was the water deep enough for the same sensors to remain informative throughout the tide? These questions help distinguish the measured change across the route from a claim about the trees alone. They are questions for examining the methods, not grounds for dismissing a study simply because nature was complicated.
Timing matters just as much as location. A pair of instruments observed simultaneously can provide a stronger comparison than observations taken on separate days with different offshore conditions. Yet even simultaneous measurements can require careful interpretation if the water reaches the instruments through different pathways. A monitoring plan should explain the intended comparison in advance. Otherwise, a collection of accurate measurements may still be poorly matched to the question the project asks them to answer.
For a public audience, the most useful distinction is between an observed reduction and an attributed reduction. The first describes what changed between measurements. The second explains how much of that change a particular mechanism caused. Attribution may require additional observations or a model. If a shallow foreshore already changes incoming waves before they reach the forest, crediting the entire offshore-to-inland difference to planted trees would overstate the planting's contribution. Conversely, excluding the foreshore from a protection strategy because it contains no trees would ignore part of the working landscape.
This is why a good project map should extend beyond the planting boundary. The administrative polygon may be convenient for a contract, but waves do not recognize its edges. A map that includes the adjacent flat, channels, settlement, and access routes is better suited to discussing performance. It allows different teams to see where their responsibilities meet and where an apparently local intervention depends on conditions outside its budget.
The bare ground may be doing important work
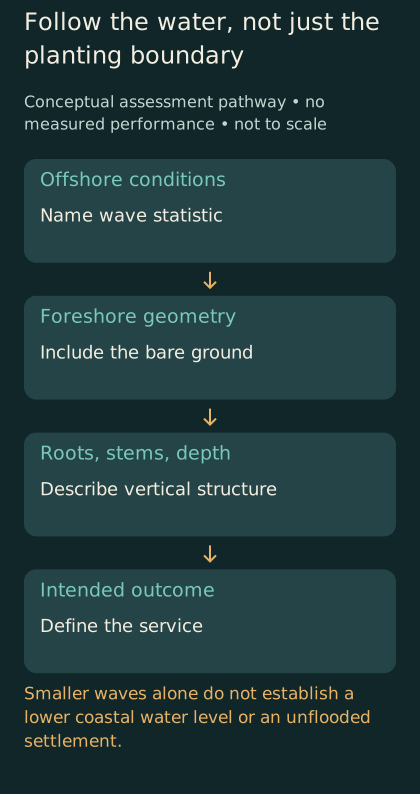
Conceptual assessment pathway, not to scale. Follow offshore conditions through foreshore and vegetation to the intended inland service. No measured performance is plotted.
A forest often receives the visual attention because people can count trees, photograph planting days, and recognize a green canopy. A low, muddy area in front of it is harder to celebrate. That imbalance can distort the project story. A coastal protection proposal should account for the full path from incoming water to the assets it intends to protect, even when some of the most important terrain looks unremarkable in a publicity photograph.
Here is a hypothetical comparison. A town considers two sites for restoration. At the first, a broad shallow approach lies in front of a narrow existing stand. At the second, a wider planting area sits beside a deeper channel. If the town ranks sites using only the area available for trees, the second may appear superior. If the intended outcome concerns wave conditions along a road, the comparison needs the water pathways and bed elevations too. The hypothetical does not establish which site is better; it shows why the initial ranking lacks enough information to decide.
This framing changes the kinds of questions that a budget should support. Surveying the ground beneath water may be less publicly visible than buying seedlings, yet it can help determine whether the project is being proposed in the right place. Monitoring a channel outside the planting plot may reveal a route by which water reaches the settlement. Recording a neighboring structure may prevent the team from attributing its influence to the forest. These activities support a defensible explanation of performance rather than merely a larger count of planted stems.
It also changes how conservation and restoration are compared. An existing landscape has a history, a current geometry, and a set of functions that may be difficult to replace quickly. A proposed planting has expectations. A fair comparison should not treat the expected mature condition of a new plot as though it already exists on the day funding is approved. Nor should it reduce the existing landscape to the number of trees that could be replaced in a different location.
A practical reporting format would distinguish the condition at approval, the condition at planting, the condition during establishment, and the condition at later assessment. Each stage could have different evidence requirements. Early reports might emphasize survival, erosion, and access for monitoring; later reports could include a better-supported assessment of the intended physical service. The sequence prevents a successful planting event from being mistaken for a completed protection system.
The same logic applies to maintenance. A living landscape does not have to resemble a concrete wall to deserve a maintenance budget. Its inspection needs may be different, but somebody still has to notice changes, retain records, and decide when additional assessment is warranted. Without that institutional continuity, the project may acquire a confident name while losing the information needed to judge whether the name remains justified.
Establishment has its own physics
The first months of a planting can be governed by a different problem from the performance of a mature forest. A small propagule or seedling must remain in place before it can contribute much vegetation structure. Balke and colleagues' 2011 experiments and field observations of Avicennia alba identified successive establishment thresholds: an initial opportunity for anchoring, sufficient root development to resist hydrodynamic forces, and further anchorage where erosion exposes roots. These results concern a particular species and study context, rather than a universal planting timetable. Original study.
The planning consequence can be expressed without prescribing a planting technique. A project should explain how its establishment assumptions connect to the conditions of the actual site. If its performance model describes a mature stand, the proposal needs an explicit account of the period before that stand exists. What is protecting people during that interval? Which outcomes will count as evidence that the project is progressing toward its intended condition? What observations would prompt a reassessment rather than another ceremonial planting?
A separate field study published in February 2022 examined restoration choices on a subsiding aquaculture coast. Van Bijsterveldt and colleagues found that brushwood barriers did not overcome subsidence sufficiently to produce the intended seaward natural expansion, although they helped survival of established plantings. Species also involved different survival and growth tradeoffs. This is evidence from that setting, not a verdict against all barriers or all planting. It demonstrates why the surrounding physical trajectory belongs in a restoration assessment. Field study.
A project organized around seedling delivery can struggle to acknowledge this kind of result. Delivery is easy to verify. The suitability of a landscape over time is harder to reduce to a procurement milestone. If the contract rewards only the number planted, the contractor may have little incentive to document why a site repeatedly loses them. The public then receives a sequence of apparently successful interventions without a clear account of whether the desired forest is becoming more likely.
A more informative agreement would keep delivery separate from establishment and establishment separate from protection performance. The organization responsible for planting could still be paid for doing that work properly, while the overall program retained responsibility for the broader outcome. This is an original governance proposal, not a claim about the contract terms used in the cited studies. Its purpose is to make the evidence correspond to the promise at each stage.
Community participation also needs a specific meaning. A person who attends a planting day has not necessarily agreed to long-term restrictions on access, fishing, drainage, or land use. A project can create real local benefits and still distribute its costs unevenly. Before calling an intervention community-led, a reporter should ask who chose the site, who can change the plan, and who bears the consequences if it does not develop as expected. Those questions concern the legitimacy of a decision, alongside the physics of its expected benefits.
A model is a set of comparisons
Models are indispensable when the question extends beyond the events that happen to have been observed. They allow analysts to explore alternative landscapes, water conditions, and assumptions. Their usefulness depends partly on making those alternatives explicit. A model result becomes difficult to interpret when a reader cannot tell whether it compares an intact forest with bare ground, a planted strip with an existing foreshore, or two different future development patterns.
Menéndez and colleagues' 2020 global study provides a clear example of counterfactual valuation. It linked hydrodynamic analysis with exposure and damage modeling to compare scenarios with and without mangroves, estimating more than sixty-five billion US dollars in annual avoided flood damage globally. That figure is modeled expected benefit, not a count of cash payments or an observed annual saving at every location. Its global aggregation should not be transferred directly into the benefit claim for a new local planting. Original global analysis.
The concept of expected annual damage is worth unpacking independently. Imagine a simplified hypothetical place with several possible flood events. Each event has a probability and an estimated loss. Multiplying each loss by its probability and combining the results produces a long-run expectation within the model. It does not mean that the place experiences that exact loss every year. Most years could differ substantially from the average, and the calculation remains conditional on the events and losses represented.
Now add a proposed intervention. The relevant comparison is the difference between two consistently constructed expectations. If one scenario assumes today's settlement and the other assumes a much larger future settlement, the difference includes more than the intervention. Similarly, changing the treatment of warning systems, evacuation, or building vulnerability between scenarios can make the result difficult to attribute. A transparent comparison holds unrelated assumptions consistent or explains why they changed.
There is a second distinction between conserving a present benefit and producing a new one. A model that removes an existing forest asks what could be lost if that forest disappeared. A model that adds a future forest asks what might be gained if the new stand develops as assumed. The two comparisons involve different starting points and potentially different uncertainties. A funding proposal should identify which one supports its headline rather than borrowing the more impressive number from whichever comparison is available.
The geographical scale also matters to interpretation. A global assessment can reveal that a service deserves attention and identify broad patterns. A site assessment must resolve details that global analysis may represent more coarsely. This is a normal relationship between scales, not a reason to reject global research. The mistake occurs when a result suited to one decision is presented as though it has already answered another, more detailed question.
Designing a useful hypothetical comparison
Suppose a coastal council is considering three options: conserve an existing forest and its adjacent flat, restore a degraded area, or combine restoration with improvements to a road and drainage system. This is an invented example for reasoning, not a description of a real council. The first task is to state what all three options will be judged against. Otherwise, conservation might be evaluated for biodiversity, restoration for planted area, and the combined option for flood losses, leaving the council with three attractive but incomparable scores.
A reasonable common outcome might be a reduction in specified disruption under a defined set of coastal conditions. That outcome would still need refinement: which road, which users, which period, and which forms of disruption? A road that remains physically intact but becomes inaccessible at its approaches has not necessarily met the same objective as a route that supports continued access. The definition should come from the people and institutions responsible for the service, with technical analysis supporting rather than silently choosing it.
Next, the council could separate current evidence from assumptions about future conditions. Existing vegetation can be surveyed. Proposed vegetation must be represented by scenarios. A planned drainage improvement can be described in engineering terms, while its future maintenance needs remain an institutional commitment. Putting these different types of information side by side makes it easier to see where a favorable result depends on something that has not yet happened.
The comparison should include an establishment period and a later operating period. A restoration option that performs well in a mature scenario may offer little immediate benefit. A road improvement may offer a different timing of benefits but require periodic maintenance. Rather than forcing these differences into one opaque score, the council could show how the intended outcome changes through time under each option. The resulting discussion would be more demanding, but it would be connected to the decisions residents actually face.
Uncertainty should be represented in a way that can affect the choice. If small changes in assumed water level reverse the ranking of options, that sensitivity belongs near the result. If the ranking remains similar across a wide range of assumptions, that robustness is useful information too. Merely attaching the word uncertain to every number gives the reader little help. Showing which assumptions matter directs attention toward the observations or decisions most likely to improve the comparison.
Finally, the council should ask what would make it change course. An adaptive plan is more credible when it identifies a decision process before disappointing evidence arrives. That does not require inventing a universal threshold here. It requires assigning responsibility for reviewing observations, explaining the basis for decisions, and retaining the resources to respond. Flexibility without authority or funding can become a promise that nobody is able to keep.
The protection claim should survive a bad photograph
Publicity tends to favor a clear visual story: green trees, calm water, smiling volunteers. A useful assessment must also make sense when the image is less flattering. A muddy monitoring site, a damaged access platform, or a patch with poor survival may contain important evidence. If the public record excludes those conditions, outsiders cannot distinguish a genuinely resilient project from one whose reporting system selects only reassuring moments.
The solution is not to photograph failure for its own sake. It is to agree on a consistent observation record. Repeated images from known locations can support communication, but they should remain separate from quantitative measurements unless their measurement role has been established. A dramatic before-and-after pair may show a real change while leaving its cause, timing, and scale unresolved. Captions should identify what is visible and what the image cannot establish.
The same restraint applies to computer-generated illustrations. A conceptual cross-section can help readers understand where waves, vegetation, and settlement sit relative to one another. It should say that it is conceptual and not to scale. A beautiful rendering of a future forest cannot demonstrate survival, wave attenuation, or avoided loss. In this article's accompanying visual package, any generated coastal scene is an editorial illustration rather than a photograph of a surveyed project.
A claim should also survive a change in audience. Engineers may ask about boundary conditions; residents may ask whether their road will remain usable; ecologists may ask about habitat development; a finance team may ask what expenditure buys which benefit. These are not competing versions of reality. They are different tests of whether the same project description is complete enough to support the decisions being made around it.
A strong public summary can accommodate those questions without becoming unreadable. It can identify the intended service, the evidence currently available, the conditions under which the estimate applies, and the work still required before relying on it. More detailed methods can sit behind that summary. The important point is that the short version should remain faithful to the longer one rather than promising certainty that disappears as soon as a reader opens the appendix.
Reading a project spreadsheet without being misled
A spreadsheet can make a weak comparison look precise because all of its entries occupy equally tidy cells. Consider an invented table with columns for project cost, forest width, estimated wave reduction, and households protected. The cost might come from a contractor's quotation, the width from a map, the reduction from a study elsewhere, and the household count from a local census. Each entry could be accurate in its original context. The row would still lack a demonstrated chain connecting the proposed expenditure to the claimed protection of those households.
A more useful table would identify the provenance of each entry and the role it plays in the argument. A measured site dimension is an input. A simulated change in wave conditions is an output conditional on inputs and assumptions. A count of households near the site is an exposure description. An estimate of avoided household flooding requires an additional connection between the physical change and the relevant flood pathways. Keeping those roles visible prevents proximity from being mistaken for demonstrated benefit.
This also helps expose a common denominator problem. Suppose two hypothetical proposals report their cost per protected household. One includes all residents behind the coastline, while the other includes only residents whose modeled flood exposure changes. The first can appear cheaper even if it has no stronger evidence of protection. A fair comparison requires a consistent definition of the denominator. The same issue arises with cost per hectare, cost per surviving tree, and cost per unit of reduced wave height: each metric answers a different question.
Time creates another accounting choice. A project could report its initial planting cost while omitting later monitoring, replacement, land access, and management commitments. Another could include those commitments in its quoted total. Comparing their headline costs would penalize the more complete estimate. A careful reader should ask for the time horizon and included activities before concluding that one approach is more economical. This is ordinary comparison logic, not a financial recommendation or a claim about any particular project's accounts.
Benefits can also overlap. If a proposal lists avoided damage, improved reliability of access, and reduced interruption to local businesses, some of those estimates might describe related consequences of the same event. Adding them mechanically could count a benefit twice. The appropriate treatment depends on the definitions and methods. The editorial test is simpler: can the project explain which benefits are distinct, which overlap, and which remain qualitative because it lacks a defensible monetary estimate?
A useful public budget does not need to convert every ecological or social value into money. It does need to keep different forms of value legible. A project might be justified partly by habitat objectives that are not captured by its coastal protection estimate. Stating those objectives directly is clearer than inflating the protection claim to carry the entire case. Conversely, a valuable habitat project should not be advertised as a safety intervention unless the evidence supports that additional role.
What an honest handover would contain
Imagine the project team is replaced five years after approval. The incoming team should be able to reconstruct what the original team promised without interviewing everyone who attended the launch. That requires more than a folder of photographs and a final expenditure statement. It requires the original outcome definition, the site description, the assumptions used in analysis, the monitoring record, and a clear account of changes made along the way.
Version history matters because a project can improve legitimately. New measurements may justify changing a model. An unexpected site response may justify revising the management plan. The record should retain the earlier version and explain the reason for the change. Otherwise, later readers cannot distinguish learning from quietly moving the target. A revised expectation can be responsible; pretending it was always the original expectation weakens trust.
The handover should also identify unresolved questions. Perhaps the monitoring period did not include the conditions most important to the protection claim. Perhaps an instrument failed during a crucial interval. Perhaps a planned survey was postponed. These gaps do not automatically invalidate every observation, but they change what can reasonably be concluded. A concise gap register can be more useful than a polished assertion that monitoring was completed.
Finally, the handover needs named institutional responsibilities rather than an assumption that somebody will keep watching. Who maintains the records? Who can commission another survey? Who communicates a change in expectations to residents? Who connects the coastal project with emergency planning and land-use decisions? A forest's physical behavior and an organization's continuity are different issues, but a dependable public service requires attention to both. The project is easier to trust when its evidence can outlast the people who first explained it.
What deserves confidence
The most defensible confidence is specific. Confidence that vegetation can change wave conditions does not settle the performance of a particular planting. Confidence that a measured transect showed attenuation does not establish protection against every relevant coastal hazard. Confidence that a modeled benefit is economically important does not identify the best local investment without a suitable comparison. Each conclusion can be valuable while leaving the next decision open.
For readers evaluating a proposal, five questions provide a practical starting point. What exact outcome is claimed? What landscape and water conditions does the evidence represent? Which parts were observed, modeled, or assumed? How will the project bridge the period between intervention and mature performance? And who will examine the evidence if the site develops differently from expectations? These questions are an editorial framework, not a substitute for qualified site-specific coastal assessment.
The encouraging feature of this framework is that it gives useful projects room to be honest. A forest does not have to guarantee an unflooded coast to provide a worthwhile service. A restoration project does not have to mature instantly to deserve support. A model does not have to predict every future event to improve a decision. What matters is that the scale of the claim remains connected to the scale and kind of evidence supporting it.
Mangrove protection becomes more credible when the green ribbon on the map acquires depth, time, and context. The roots have a geometry. The water has several kinds of motion. The foreshore has a role. The settlement has particular vulnerabilities, and the people responsible for the project have obligations that continue after planting day. Those details make the story less simple. They also make it useful enough to guide an actual conversation about a coast.