
Survival, reproduction, exposure and statistical precision answer different questions. A defensible pollinator assessment has to keep those questions connected without pretending they are interchangeable.
The reassuring result that needs a second sentence
A laboratory report says that exposed bees did not die at a significantly higher rate than controls. A public announcement turns that into a much shorter statement: the product is safe for bees. The distance between those sentences is where much of the real scientific and public-interest argument begins. The experiment may have been useful and competently performed. The announcement may still describe more species, more exposure conditions and more consequences than the experiment could establish.
A July 2026 methods preprint by Dimitry Wintermantel and colleagues puts one part of that gap under scrutiny. Using simulated honeybee field studies, the authors examine equivalence testing, replication and the ability to distinguish effects relative to a protection goal. The work is a methodological preprint, not a new legal requirement or a field demonstration that a named product is safe or unsafe. Its author abstract is the basis for this brief description. July 2026 equivalence-testing preprint.
The wider question is more concrete than a dispute over statistical terminology. What result would justify the claim a reader is being asked to believe? Surviving an observation period, maintaining a colony, successfully mating and producing a subsequent generation are related outcomes, but they are not identical. Neither are a honeybee worker, a bumblebee and a solitary bee interchangeable test instruments. A useful account of risk starts by specifying the claim rather than beginning with the adjective safe.
This article uses an original fictional review meeting to explore those distinctions. The participants are not real researchers, regulators or agricultural businesses. The numerical exercises are invented explanations, not pesticide trial results. No application rates, treatment schedules or product-use recommendations are provided. The purpose is to help readers evaluate evidence and public claims, not to replace a product label, qualified agricultural advice or a jurisdiction's regulatory assessment.
The fictional meeting has three questions on its agenda. What was actually exposed? What was actually measured? How much confidence can the evidence support? Those questions sound elementary. They become demanding when a report must connect laboratory observations to a changing landscape, multiple life stages and a decision that cannot wait for complete knowledge of every species.
Begin with a claim that can be checked
The first person at the meeting writes a proposed headline on the board: no harm to pollinators. Another crosses out the final word and asks which pollinators were studied. A third asks what counted as harm. The exercise is not an attempt to make communication impossible. It is a way of turning an unbounded assurance into a statement that evidence could genuinely support or challenge.
A bounded claim has several coordinates. It names the organism or population, the exposure route and duration, the endpoint, the comparison and the conditions under which the result was obtained. It also identifies the uncertainty. A reader does not need a toxicology qualification to notice when a headline quietly drops most of those coordinates. The missing information may be exactly what matters for a different species or a different use setting.
The United States EPA's pollinator guidance page was updated in June 2026, but the linked foundational guidance is dated June 19, 2014. That document describes a tiered assessment and explicitly discusses the use of honeybee data as a surrogate, alongside additional evidence from other bees as methods develop. The webpage's update date must not be mistaken for the publication of a wholly new 2026 scientific framework. EPA guidance document.
For the fictional reviewers, this distinction changes how they write their own report. They do not accuse a test of being defective merely because it has a defined scope. They ask whether the scope matches the conclusion. A narrowly designed experiment can provide strong evidence about its own question. Trouble begins when its answer is expanded into a universal assurance without the additional reasoning or observations needed for that expansion.
The same discipline applies to alarming claims. An effect under one laboratory condition does not automatically establish the scale of population damage in every landscape where a substance might be encountered. A responsible critic should identify the finding, the plausible concern and the unresolved extrapolation separately. Precision is not a concession to either side of a controversy. It is what allows evidence from different studies to be combined without erasing their differences.
Species are not merely different sizes of the same bee
The meeting's first evidence packet concerns laboratory testing across species. Dewaele and colleagues reported in 2024 an exposure protocol adapted for wild bees and species-specific responses to sulfoxaflor. Nine species could be included after the practical challenge of maintaining bees under laboratory conditions. The study found differences in sensitivity, rather than a single response that could simply be assigned to every bee. The laboratory-housing selection itself is a boundary on interpretation. Dewaele and colleagues, 2024.
That result prompts a useful thought experiment. Suppose a purchaser receives a safety dossier for a machine used in a warehouse. The dossier tests one model on a flat floor with a particular load. Nobody would automatically assume that the same result described every machine, every surface and every task. Biological extrapolation is more complicated than the machine analogy, but the communication error is similar: a representative is being treated as the entire represented category.
The reviewers therefore separate two questions. Is a surrogate practical and scientifically informative? Does the evidence establish that it is sufficiently protective for the particular organisms and endpoints of interest? A positive answer to the first question is not a complete answer to the second. Conversely, finding differences among species does not prove that every existing surrogate-based assessment is useless. It tells the reader where the justification for extrapolation needs to be explicit.
An evidence table should make missing coverage visible. Rows might name the tested species and the intended protection target. Columns might identify adult survival, reproductive outcomes, developmental stages and the route of contact. Empty cells should remain empty or be marked as unresolved. Filling them with a reassuring color because a nearby cell contains a favorable result would turn a visual summary into an unsupported inference.
The practical implication for public communication is simple but important. A statement about honeybee workers should retain those words when the distinction matters. A statement about a solitary species should not be promoted into a conclusion about all wild bees. Readers can then understand both the value of the finding and why further work may be needed. The specificity makes the result more usable, not less meaningful.
Exposure is a route through the world
A hazard statement concerns the capacity to cause an effect under some conditions. A risk assessment also has to consider whether and how organisms encounter the relevant exposure. In the fictional meeting, the reviewers draw a path rather than a ranking: a material is present somewhere, an organism encounters it through a route, an internal or external dose develops, and an effect may follow. Each arrow represents a question rather than a guaranteed transition.
EFSA's May 2023 guidance summary distinguishes acute contact, acute dietary, chronic dietary and larval dietary risk cases. It also states limitations, including environmental matrices for which evidence was insufficient, and distinguishes its scope from combined exposures across an agricultural season. Its honeybee colony-size protection goal reflects a risk-management agreement, not a universal biological boundary for all bees. This article describes the dated scientific guidance, not the present implementation status of every European jurisdiction. EFSA's official guidance summary.
The fictional team uses that structure to improve a proposed infographic. The first version shows a bottle pointing directly to a bee. The revised version shows several possible routes and labels the ones actually represented by evidence. It also includes an explicit box for conditions not assessed. The second graphic is less dramatic, but it prevents the reader from assuming that one route automatically covers all the others.
Consider an invented pair of studies. One examines a brief external contact. Another examines repeated dietary exposure. Even if the final measured amount in some comparison were similar, the studies would not necessarily ask the same biological question. Timing, duration and the relationship to the organism's activities can matter to interpretation. The reader should not collapse these into a single exposure score without understanding what the score preserves and what it discards.
The same caution applies to the phrase field-realistic. It can describe how a researcher selected a concentration or scenario, but it does not by itself mean that every feature of an experiment reproduced an entire field season. A useful report explains what was realistic, what remained controlled and which other conditions could change the result. That explanation is more informative than treating realism as a switch that turns uncertainty off.
Alive is one endpoint, not the definition of success
At the meeting, a reviewer proposes a simple ladder: survival, physiological condition, behavior, reproduction and population outcome. Another objects that the ladder could imply a fixed sequence in which every change necessarily travels upward. They replace it with a set of connected questions. A measured change at one level may motivate investigation at another, but the connection has to be demonstrated or modeled rather than assumed.
Murawska and colleagues' January 2025 study examined biochemical markers in honeybee workers after colonies received tested pesticide formulations, singly or in combinations. Different treatments produced different marker responses; an absence of significant change for a tested marker was not a universal finding of no biological effect. The paper offers evidence about the measured biomarkers in its study conditions, not a direct census of colony survival or wild-bee population trends. Murawska and colleagues, 2025.
The original analytical point is that a sensitive measurement and a consequential measurement are not automatically the same thing. A marker can be useful precisely because it detects a change before a larger outcome is visible. But the significance of that change for an organism's future performance requires interpretation. A report should neither dismiss a marker because it is not mortality nor present every marker shift as proof of population collapse.
The reviewers ask the authors of their fictional dossier to provide an endpoint map. For every measured variable, the map states what observation supports it, why it was selected and what larger inference is proposed. Where the connection to a larger outcome remains uncertain, that uncertainty receives its own sentence. This prevents a list of statistically notable measurements from becoming a story whose apparent coherence exceeds the evidence.
A public reader can apply the same test to a headline. Does the article say that a behavior changed, that reproduction changed or that the number of animals in a landscape changed? If it moves between those statements, does it explain the bridge? Scientific concern can be justified before a final population effect is measured. But concern, mechanistic evidence and a quantified population result should remain distinguishable in the account.
Reproduction changes the question
A study can look beyond immediate survival without claiming to observe an entire ecosystem. Vélez-Trujillo and colleagues' 2025 research on the solitary bee Osmia bicornis examined mating behavior and male fertility following short-term chronic sulfoxaflor exposure. It reported changes in reproductive measures, including reduced mating success and sperm quantity. The opened university manuscript supports that description; it does not justify transferring the reported effects unchanged to all species or field populations. Vélez-Trujillo and colleagues, 2025.
The fictional reviewers use the example to change the wording of a question. Instead of asking only whether an exposed adult remained alive, they ask what evidence bears on successful continuation into another generation. This does not mean every study must measure everything. It means an assessment needs to explain how its chosen observations relate to the outcome it ultimately seeks to protect.
Imagine a deliberately simplified population accounting exercise. There are one hundred reproductive individuals at the start of two invented scenarios. In both, ninety survive the observation interval. In the first scenario, sixty subsequently meet a defined reproductive-success criterion. In the second, forty do. The survival totals are identical, yet the reproductive totals differ. These invented numbers do not predict any bee population; they show why identical survival can leave another important question unanswered.
The reverse warning is also necessary. A difference in a laboratory reproductive measure is not, by itself, a complete forecast of a landscape's future abundance. Other processes and conditions intervene. A strong assessment identifies those processes and asks whether evidence or a validated model can connect them. The distinction protects the meaning of the reproductive finding rather than weakening it through an overly ambitious headline.
The meeting's final wording retains both sides: the observed endpoint matters, and its broader consequences require a stated inference. That is a better public account than either declaring the species doomed or declaring the study irrelevant because it did not count every bee outdoors. Much of good environmental reporting consists of preserving the middle ground where a result is important without being omniscient.
A mixture is a question, not an automatic verdict
Rondeau and Raine's 2024 study used a crossed design to examine single and combined pesticide exposures in ground-nesting squash bees. Their primary Dryad record describes behavioral and offspring outcomes, including reduced emerging offspring per nest under combined exposure relative to individual treatments. The record also documents enclosure, treatment and offspring variables. This article inspected that record and its accompanying description, not an independently rerun analysis of the downloadable spreadsheet. Rondeau and Raine's primary data record.
For the fictional meeting, the important design question is whether a combined treatment can be compared with the relevant individual treatments and a control. A claim about interaction requires a reference expectation. Without one, the statement that a mixture caused an effect may be true but still leave unanswered whether the combined response was greater than, similar to or less than the expectation under a particular model.
An invented arithmetic example makes the distinction visible. Suppose a chosen outcome is measured on a scale where a control averages one hundred units. Treatment A averages ninety, treatment B averages eighty and the combination averages seventy. Under a simple additive-loss model, the combination equals the expected ten-unit plus twenty-unit reduction. Under a different model or scale, the comparison could be framed differently. The numbers alone do not choose the biological interaction model.
Now suppose the combination averages fifty. That raises a different question under the same additive-loss reference. But even then, uncertainty, replication and the appropriateness of the reference model matter. It would be premature to announce a universal synergistic mechanism from four displayed averages alone. The example is a lesson about the logic of comparison, not a conclusion about any real pesticide pair.
A useful public summary should name the tested combination and endpoint, identify the comparison and avoid converting a specific interaction result into a claim that every chemical mixture behaves the same way. Equally, a favorable single-substance result should not be treated as proof about every combination. The right response to complexity is a better-specified question, not an automatic answer in either direction.
The difference between no detected effect and a bounded effect
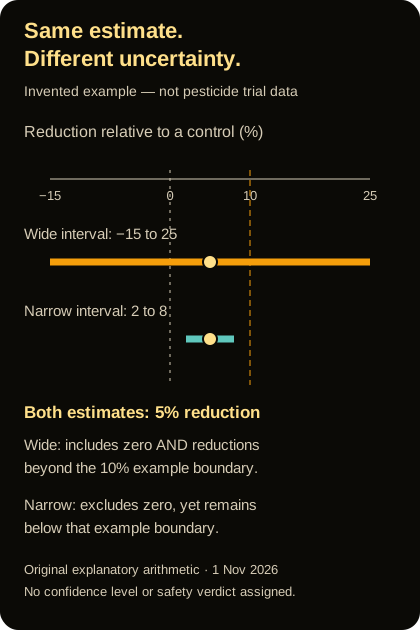
Original invented interval example, 1 November 2026. Both estimates are a 5% reduction; the wide interval is −15% to 25%, the narrow interval 2% to 8%. The 10% line is an illustrative decision boundary. No actual trial data, confidence level or safety verdict is asserted.
The fictional reviewers now examine two invented reports. Both estimate a five percent reduction in an outcome relative to a control. One has a very wide uncertainty interval; the other has a narrow interval. A headline based only on the estimated reduction would make them look equivalent. A headline based only on whether a conventional significance threshold was crossed could also hide what each study can actually exclude.
For explanation, suppose the wide interval runs from a fifteen percent improvement to a twenty-five percent reduction. The narrow interval runs from a two percent reduction to an eight percent reduction. These are invented intervals, not results from the cited studies, and no particular confidence level is being assigned to them here. The first includes both no difference and reductions larger than ten percent. The second excludes no difference but stays below a ten percent reduction.
If the question is whether an effect differs from zero, those intervals suggest one kind of interpretation. If the question is whether a reduction of ten percent or more can be excluded under an appropriate procedure, they suggest another. The same dataset is not being judged by a mysterious new definition of truth. The question has changed, so the evidence required to answer it has changed too.
This is why a report should state its decision rule before presenting a favorable or unfavorable adjective. An absence of a detected difference may reflect a small effect, a noisy estimate, an insensitive design or some combination. A positive result in a test against zero need not imply that an agreed practical boundary has been exceeded. Neither conclusion can be read responsibly without knowing the target of the analysis.
The meeting therefore rejects a proposed two-color graphic labeled safe and harmful. It replaces the colors with statements about what the evidence does and does not exclude. An intermediate category is retained for unresolved cases. That category is not a failure of science. It is an honest description of the information available, and it helps identify whether additional observations could change the decision.
Precision is designed before it is calculated
A report cannot create independent information merely by measuring the same experimental unit many times. In an original fictional example, imagine that several observations are taken from each of four enclosed settings. The total number of recorded rows might be large, while the number of independently assigned settings remains four. A reader who sees only the row count could misunderstand the amount of independent evidence supporting a treatment comparison.
The lesson is not that repeated measurements are worthless. They can reveal variation through time and improve understanding of what happened within a setting. The lesson is that different forms of replication answer different questions. The report should make the unit of treatment assignment, the unit of observation and the unit used in the analysis intelligible to a reader.
The same principle applies to timing. A long sequence of measurements after one exposure episode is not automatically equivalent to observations from many independently varying landscapes or seasons. More timestamps can improve some estimates while leaving other uncertainties largely unchanged. A clear account says which uncertainty has been reduced rather than presenting a larger file as an unconditional increase in generality.
At the fictional meeting, the team asks for a diagram of the sampling structure before looking at a significance value. The diagram shows which observations share a location, treatment assignment or other common condition. It also shows what was randomized and what was merely observed. This is a practical communication device: it helps non-specialists understand why two studies with similar-looking sample counts may support different strengths of inference.
There is also a budget lesson. The cheapest measurement is not necessarily the measurement that most improves a decision. If uncertainty is dominated by differences among settings, collecting many additional readings within one setting may be less informative than the decision-maker assumes. That is a design question to resolve with qualified statistical and ecological expertise, not a universal prescription for a particular number of sites.
Models connect scales, but their boundaries remain visible
A June 2026 preprint by Schunck and colleagues coupled laboratory-derived survival modeling with a landscape simulation for Osmia bicornis exposed to a sulfoxaflor formulation. Its author abstract reports small modeled population effects in the adult-survival scenarios and potentially greater effects when larval mortality was explored. These are model results under specified assumptions, not direct observations proving safety across landscapes. The abstract, rather than a full independent model audit, supports this description. June 2026 landscape-modeling preprint.
For the fictional reviewers, the value of a model is not that it makes missing knowledge disappear. It provides a place where assumptions can be stated, connected and tested for their consequences. If a conclusion changes when an omitted life stage is represented, that is useful information about the structure of the problem. It should not be hidden because a simpler version produced a more convenient answer.
The team draws three boxes: observations used to fit a model, mechanisms and assumptions inside it, and observations reserved to challenge its predictions. They do not allow the same apparent agreement to be described casually as both fitting and independent validation. A model can reproduce data it was adjusted to match while still requiring a separate test of how well it predicts new conditions.
Sensitivity analysis also has a communication role. A public summary can identify which uncertain assumptions most influence the result without reproducing every equation. If changing one poorly known quantity reverses the conclusion, that fact deserves prominence. If a result remains stable across a carefully justified range, that stability is informative too. Neither outcome eliminates the need to explain how the range was chosen.
A modeled result and a laboratory finding need not contradict each other merely because their headline implications differ. They may concern different endpoints, time scales or represented processes. Before declaring a scientific conflict, a reporter should compare the questions and assumptions. Sometimes the disagreement is real; sometimes the apparent disagreement was created by compressing two distinct claims into the same word, risk.
A landscape is not a single treatment container
The fictional meeting moves from controlled comparisons to evidence collected across crop fields. Knauer and colleagues' study, published online in December 2025 and in a January 2026 issue, synthesized bee-assemblage data from 681 fields across three continents. Its author abstract reports negative relationships with pesticide hazard and reduced surrounding semi-natural habitat, without evidence that habitat availability buffered the pesticide relationship in that synthesis. It is an analysis of assembled field data, not a newly randomized pesticide experiment. Knauer and colleagues, publication record and abstract.
The practical question is how to discuss multiple pressures without using one to erase another. A fictional land manager might say that creating habitat solves the exposure problem. Another might say that reducing one exposure makes habitat irrelevant. Neither conclusion follows simply because both factors appear in the same discussion. Measures can address different pathways, and the evidence for one pathway does not automatically settle the other.
An original decision table helps the meeting avoid that mistake. One column asks what an intervention is intended to change. Another asks how that change will be observed. A third asks what important pressures remain outside its scope. A habitat project might have clear goals and useful outcomes while still leaving an exposure question unresolved. That is not a reason to dismiss the project; it is a reason to describe its contribution accurately.
Observational evidence deserves neither automatic rejection nor automatic causal certainty. It can cover variation and contexts that would be difficult to reproduce experimentally, while also requiring careful treatment of confounding, measurement choices and selection. A public account should explain whether an exposure was measured, estimated from use information or represented by a proxy. Those alternatives can be useful, but they do not mean exactly the same thing.
The meeting's conclusion is therefore deliberately plural. Several forms of evidence can be relevant to a landscape decision, and their strengths are not interchangeable. Controlled experiments help isolate specified comparisons. Field observations help describe patterns across settings. Models can explore connections and counterfactuals. A defensible assessment explains how these pieces constrain the conclusion rather than assigning one universal winner among methods.
What an honest public dashboard would show
The fictional team has been asked to turn its review into a public-facing page. The first design contains a single large percentage and a green badge. It is visually efficient and analytically inadequate. Readers cannot tell which species, endpoint, time window or comparison produced the percentage. The team decides that the first screen must communicate the central distinction before presenting a compact summary.
The revised page begins with a one-sentence claim and a one-sentence limit. Under those sentences sit labeled cards for tested organisms, exposure conditions, measured outcomes and remaining uncertainties. Color assists scanning but carries no meaning that is absent from text. A favorable result is described as favorable for a named endpoint under stated conditions, not as a universal approval stamp.
An evidence-date line separates publication date, data-collection period and the date the page was last reviewed. This is especially important when a current webpage links an older guidance document or a recent article analyzes observations from previous years. The design should help readers notice those distinctions rather than rewarding the mistaken impression that every date on the page refers to a fresh experiment.
A methods drawer can contain the sampling structure, comparison and statistical decision rule in more detail. It should be available without forcing every reader through technical material before understanding the main point. Conversely, the main point must remain accurate if the drawer is never opened. Essential limitations belong beside the result, not solely in a collapsed panel that most readers may miss.
The dashboard also keeps a correction history. If an endpoint was mislabeled or a source was interpreted too broadly, the correction should identify what changed and why. Maintaining that history is a form of accountability. It helps readers distinguish a genuine revision in evidence from a silent alteration in wording, and it gives the publisher a record against which future summaries can be checked.
A worked audit of a fictional assurance
To make the review process concrete, imagine that a regional purchasing group receives a three-page environmental assurance from a supplier. The cover says that a proposed choice poses no meaningful risk to bees. The attachment contains a short adult-survival experiment, a reference to general guidance and a graph with error bars. None of those elements is inherently suspicious. The problem is whether together they support the cover statement.
The group's first step is to rewrite the assurance as a testable sentence. It identifies the tested species, the exposure represented, the survival interval and the comparison with controls. That sentence is narrower than the cover claim, but it is now possible to check. The group does not quietly substitute a different endpoint, such as reproductive success, because that endpoint would sound more relevant to its overall objective. It records that the attachment did not directly measure it.
Next, the group checks the graph's denominator. Does the displayed percentage refer to all organisms originally assigned, only those with a completed observation, or some other subset? If observations are missing, the group asks how they were handled. It does not assume that every missing observation means death, nor that every missing observation can be ignored. The meaning of the percentage depends on the accounting rule, so that rule belongs in the explanation.
The third step concerns the comparison. The purchasing group asks what conditions the controls experienced and whether the treatment assignment allows the proposed inference. It distinguishes a result from a controlled experiment from a comparison between pre-existing sites that differed in other ways. The latter might still be informative, but it requires a different account of alternative explanations. The group refuses to make the methods seem stronger by changing the vocabulary.
The fourth step checks the uncertainty interval against the assurance's practical claim. If the interval still includes effects the group considers important, the report cannot reasonably say those effects have been excluded. The group also resists the opposite mistake: it does not describe every imprecise estimate as evidence that the largest compatible effect actually occurred. Compatibility, estimation and decision-making remain separate concepts in the revised summary.
Finally, the group builds a claim ledger with three columns: supported here, unresolved here and outside this assessment. Adult survival under the test conditions might enter the first column. Reproduction could enter the second if it matters to the decision but was not evaluated. A conclusion about every pollinator in every agricultural setting belongs in the third. The ledger turns a vague dispute about confidence into a concrete discussion of the evidence needed for each claim.
The resulting decision document is not necessarily longer than the supplier's original assurance. It is better organized. The first paragraph gives the bounded finding. The second explains what remains uncertain and why it matters to the purchasing objective. A short annex records the evidence, the assumptions and the person or institution responsible for resolving questions outside the group's competence. The group has improved its reasoning without pretending to conduct a new toxicological assessment.
Updating a conclusion without rewriting its history
An assessment should also have a rule for revision. In the fictional exercise, the purchasing group specifies in advance what kinds of new evidence would prompt reconsideration: a relevant endpoint not previously assessed, a better-supported exposure estimate, a correction to the original analysis or a change in the conditions to which the conclusion is being applied. These are triggers for review, not automatic declarations that the earlier conclusion was dishonest.
The distinction matters because knowledge changes for several reasons. A new observation can reduce uncertainty. A new method can reveal that an old measurement had a limitation. A changed use context can make an otherwise valid result less applicable. Recording which of these occurred helps readers understand the revision. It also discourages the misleading narrative that every update proves either that science failed or that the earlier uncertainty never mattered.
Questions that improve a decision without pretending to settle it
A reader facing a pesticide-risk claim can begin with a small set of concrete questions. Which organism was tested? What exposure was represented? Which outcome was observed, and over what interval? What comparison supports the conclusion? What important effect size could the study reasonably exclude? These questions do not produce a regulatory verdict, but they often reveal whether the public statement fits the evidence.
The next questions concern transfer. How does the tested organism relate to the organism the decision seeks to protect? Which untested routes or life stages could matter? If a model connects individual effects to population outcomes, what assumptions drive that connection and how has it been challenged? Asking these questions is more productive than treating every uncertainty as proof of danger or every completed test as proof of universal safety.
A final set concerns responsibility. Who has the authority to make the decision, what protection objective is being used and how will new evidence be incorporated? Scientific measurements can inform these choices without independently deciding every acceptable trade-off. A transparent assessment distinguishes empirical findings from policy judgments and makes the relationship between them visible.
The fictional meeting ends without the universal sentence that opened it. In its place is a bounded conclusion, an account of the evidence, and a list of observations that could change the assessment. That may sound less satisfying than a one-word verdict. It is considerably more useful to anyone who has to explain a decision, revisit it or recognize when its assumptions no longer hold.
A bee alive at the end of a test is a meaningful observation. It is not the whole story of exposure, reproduction, populations or uncertainty. Better pollinator assessment does not require pretending every study can answer every question. It requires keeping the questions distinct, connecting them honestly and refusing to let a reassuring or alarming adjective outrun the evidence behind it.
Editorial and source-access note
Prepared November 1, 2026; not published. The fictional review meeting, examples and dashboard recommendations are original explanatory devices. Eight distinct primary works support the core article, plus one original pooled field-data analysis. Guidance documents are primary evidence of the issuing bodies' methods, not empirical trials. Preprint descriptions are explicitly based on author abstracts. Rondeau and Raine's primary data record was inspected; its downloadable analysis was not rerun. No real pesticide-use instructions or legal-status assessment is supplied. Visuals are illustrative, not documentary photographs or measured trial data.