
Echoes can reveal enormous stretches of the ocean. Turning them into a defensible fish-stock estimate requires biological samples, calibration, survey design and an honest account of what changed.
The warning attached to a number
A fish-stock estimate can look like a simple answer to a simple question: how many fish are out there? The number may be printed to several decimal places, accompanied by a colorful map and described in tonnes. Yet between the ocean and that number lies a chain of measurements, classifications, biological samples and statistical assumptions. Understanding the chain is essential when the result informs decisions about food, livelihoods and ecosystems.
A February 2026 notification from NOAA and Fisheries and Oceans Canada illustrates the point unusually clearly. It reported a 2025 acoustic-trawl survey estimate for Pacific hake aged two and older, while explicitly warning that the estimate should not be used directly as the absolute stock size or to predict total catch levels for 2026. It also stated that the draft assessment did not incorporate that survey estimate while the changed methodology awaited review. These were statements about that assessment process, not a declaration that acoustic surveys had become useless. February 2026 survey notification.
The scientific-review report for the February 2026 meeting describes why comparability needed attention: a changed survey format and net, lost survey time, wider spacing in parts of the survey, and fewer validation tows. The opened PDF's document title identifies it as a working draft. Its observations are therefore attributed to that dated review document, not presented as an independently established final account of every later management decision. 2026 scientific-review report.
The public-interest story is not simply that a survey had uncertainty. Every meaningful survey does. The story is that changes in how the ocean is observed can complicate changes in the estimated fish population. A new method may improve some aspects of observation while making a long-running time series harder to interpret. More capable equipment does not automatically produce a seamless continuation of the old index.
This article follows an original fictional survey-review workshop to explain the measurement problem. Its arithmetic examples are invented, not reconstructions of the Pacific hake assessment or recommendations for catch limits. The aim is to make the logic of acoustic estimation understandable enough that a reader can ask what a number measures, which uncertainties it includes, and what decisions it can responsibly support.
An echo is not a species label
An acoustic instrument sends sound and records returning signals. The signal contains information about scattering objects in the sampled water, but it does not arrive with a biological name attached. Interpreting a layer as a particular fish species requires more than seeing a bright region on an echogram. Other organisms and physical features can contribute signals, and the relevant distinctions depend on the equipment, frequencies and analysis.
NOAA's Pacific hake biological-data record explains the complementary role of trawl samples: they help classify observed backscatter by species and size and provide biological specimens. The record was updated in March 2026, but its descriptive text retains details of the earlier survey arrangement. It is useful evidence for the role of biological sampling, not a substitute for the separate documentation of the changed 2025 design. NOAA biological-data record.
At the fictional workshop, an analyst begins with a deliberately simple picture. A patch of returning sound is evidence that something scattered the transmitted sound under the instrument's conditions. To turn it into an estimate for a target species, the analysis must decide how much of that signal belongs to the species. To turn the assigned signal into numbers or mass, it must use an appropriate relationship between scattering and the animals represented.
Those steps can be reliable without being direct visual counting. Many scientific measurements infer an underlying quantity through a model. The important requirement is to keep the inference visible and test the assumptions that matter. Calling an echogram a photograph of the stock may make an engaging caption, but it encourages the reader to overlook the classification and conversion stages.
The workshop therefore proposes a diagram with separate boxes for calibrated signal, biological interpretation, conversion to abundance or biomass, spatial expansion and stock assessment. Each box has its own evidence. A problem in one box does not automatically invalidate every other box, but confidence in one cannot silently certify the rest. The diagram becomes a guide to asking a more useful question than whether the survey is simply right or wrong.
The same total can produce different species estimates
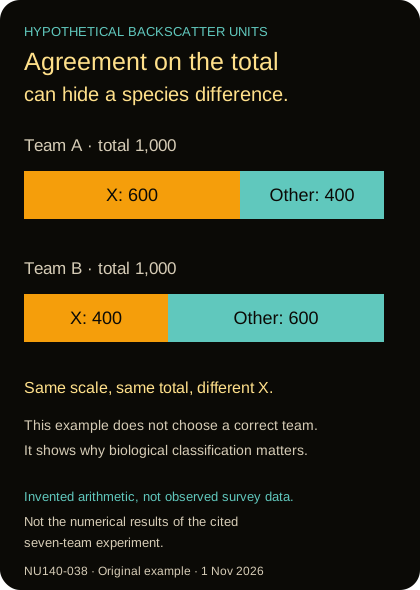
Original hypothetical backscatter allocation, 1 November 2026: both teams total 1,000 invented units; X receives 600 or 400. These are not the numerical findings of the cited seven-team study and do not identify a correct classification.
A 2024 experiment asked seven expert teams to classify the same acoustic survey data. The teams broadly agreed on the overall acoustic energy attributed to organisms but differed in how they allocated it among target categories. The institutional research record identifies differences in thresholds and species interpretation as contributors. This is a controlled comparison of expert interpretation, not a claim that every survey's classifications are arbitrary. Seven-team classification study.
An original numerical example shows why that distinction matters. Imagine a calibrated biological backscatter total of one thousand invented units. Team A assigns six hundred to Species X and four hundred to other organisms. Team B assigns four hundred to X and six hundred elsewhere. They agree perfectly about the total while disagreeing substantially about the target species. A chart showing only total signal would conceal the difference relevant to the fishery.
The example does not establish which team is correct. It identifies the need for evidence that discriminates among allocations. Biological samples, multiple acoustic frequencies, spatial context or other observations may help, but each must be evaluated in the actual survey design. Simply averaging the two classifications can produce a compromise without resolving why they differ.
The workshop's proposed review records disagreements rather than treating them as embarrassing noise. Which regions were difficult? Which additional data would have changed the interpretation? Did reviewers apply the same rules? A disagreement concentrated in a few high-signal regions may matter more for the final estimate than many disagreements in weak-signal background. Counting disputed pixels is not necessarily the same as measuring their effect on biomass.
This is also a reason to preserve annotations and their history. If a region's classification changes after new information arrives, a later analyst should be able to see both the old decision and the reason for revision. The goal is not to freeze interpretation permanently. It is to make revisions traceable so that a change in the estimate can be separated from a change in the ocean.
The conversion depends on the fish you think you saw
The relationship between an acoustic return and an animal is often discussed through target strength. In broad terms, it characterizes how strongly a target scatters sound under defined conditions. A conversion from aggregate backscatter to fish abundance therefore depends on a model of the animals contributing to that backscatter. Species, size and other relevant properties cannot be treated as optional decorations after the acoustic total has been calculated.
David MacLennan's paper on real-time target-strength calibration was published online in December 2010 and appeared in a 2011 journal issue. It examines a specific measurement arrangement in which a calibration sphere can itself affect signals from fish, and develops corrections for that geometry. The study is a useful reminder that even a calibration aid has a physical relationship to the measurement. It is not evidence that all sphere calibrations are invalid. MacLennan.
The fictional workshop uses a transparent toy conversion. Suppose one hundred units of assigned backscatter are interpreted using a mean contribution of one unit per fish. The estimated number is one hundred. If the appropriate mean contribution were instead two units, the same total would imply fifty fish. The echo total has not changed; the biological conversion has. Real survey relationships are more complicated, but this arithmetic isolates the dependency.
Mass adds another distinction. Fifty larger fish can weigh more than one hundred smaller fish. An abundance estimate and a biomass estimate are therefore different outputs, even if they share some observations. An age-class proportion by number should not be read as the same proportion of total mass. A report should identify which quantity is being described rather than relying on the everyday ambiguity of more fish.
The workshop proposes keeping the conversion assumptions next to the result. That does not mean printing every equation in a headline. It means providing a readable account of which biological samples informed the relationship and how uncertainty in that relationship affects the estimate. A small formal sampling error does not eliminate uncertainty in the conversion model.
The net is part of the acoustic instrument
It may seem strange that changing a trawl net can affect an estimate derived from sound. The reason is that the trawl provides information used to interpret the sound. If the new gear samples sizes or species differently, the biological picture supplied to the acoustic analysis can change even when the underlying fish community does not.
The February review describes the new net retaining more small hake in comparative work and discusses the implications for interpreting age groups. That observation belongs to the dated review's account of a methodological transition. It should not be converted into a claim that the entire apparent population change was caused by the net, nor into an accusation that the survey team knowingly produced misleading numbers. The report records a problem being investigated, not a license to assign an unsupported motive.
In the fictional workshop, the simplified example is a mixed school containing equal numbers of small and large fish. Imagine that an old net retains one in four small fish and three in four large fish, while a new net retains equal fractions of both. Their catches will show different size mixtures even though the school is unchanged. Treating each catch mixture as a perfect census would make the apparent biology depend on the gear.
The remedy is not necessarily to refuse new gear. Improved sampling may be worth the transition. The scientific task is to understand the relationship between old and new observations, including where a simple conversion is inadequate. Comparative sampling should be designed around the differences that affect the intended estimate, rather than assuming that one overall correction factor resolves every size and species combination.
A useful public explanation would say what improved, what changed and what remains uncertain. That is more informative than presenting modernization as automatically seamless or describing every methodological change as a break that destroys the historical record. Long-term observation programs need both innovation and continuity, and achieving both requires explicit comparison work.
A line through the sea is a sample of a landscape
An acoustic survey can collect a very large number of pings along a vessel's route. That volume of data does not mean the vessel observed every location in the survey region. The route is a sample of a spatially structured landscape. Millions of measurements close together along a few tracks cannot be interpreted as millions of independent observations spread evenly across the whole ocean.
The fictional workshop illustrates this with a square region divided into one hundred cells. A vessel samples ten narrow tracks. If fish are spread fairly evenly, several reasonable spatial estimators might produce similar totals. If most fish occupy a few compact patches between tracks, the result becomes more sensitive to where the tracks happened to pass and how the unsampled space is modeled. More pings on an already sampled track do not automatically solve the missing-space problem.
This is why a survey map should show tracks as well as the final smooth biomass surface. The surface may be a valuable estimate, but the tracks reveal the support behind it. A smooth map without sampling locations can look like complete observation even where it is interpolation. A dense cluster of points can also look like broad coverage when the points are concentrated along the same narrow route.
The workshop's proposed figure distinguishes observed segments from estimated areas. It does not color unsampled space as empty ocean. Absence of an observation is not an observation of absence. Nor does a model prediction become a direct count simply because the map uses small cells. Display resolution is a design choice; information resolution depends on the observations and assumptions.
Spatial patchiness also affects uncertainty. If a few tracks account for much of the estimated biomass, the analysis should examine how sensitive the result is to those observations and to the method used to expand them. That does not mean discarding strong signals as inconvenient outliers. It means recognizing that the structure of the sampled population can change the behavior of the estimator.
Missing time at sea is not a random blank by default
A survey can lose days to weather, equipment problems or other operational constraints. The statistical consequences depend on what was missed. If the unobserved region differs systematically from the observed region, treating the gap as though it were a random handful of missing pings may understate the problem. The cause and pattern of missingness deserve attention.
The fictional team considers two invented losses. In the first, a short interruption removes scattered segments from many tracks. In the second, an interruption removes most coverage of one region during a period when fish distribution may differ from elsewhere. Both losses can involve the same number of hours, yet they need not have the same effect on the estimate. A single survey-completion percentage cannot capture that distinction.
The proposed cruise report therefore separates planned coverage, achieved coverage and the reasons for important gaps. The purpose is not to blame the crew for conditions beyond its control. It is to let the analysis use the actual survey rather than an idealized design that was never completed. Operational transparency is part of statistical transparency.
The workshop also asks whether the survey's biological validation samples were reduced in the same places as its acoustic coverage. A dataset may retain abundant acoustic returns while losing some of the samples needed to interpret them. The missing information is then not only spatial; it concerns the species and size mixture assigned to the signal. Reporting the number of acoustic records alone would miss this limitation.
Contingency planning can make the next survey more informative. Before sailing, a team can identify which observations are essential to its main questions and what alternative analyses would be possible if coverage changes. This is not a substitute for field resources. It is a way to avoid improvising the entire inferential strategy after discovering that the planned dataset does not exist.
A time series can change because its ruler changed
A long series of survey estimates is valuable because it can reveal change over time. But a trend combines changes in the population with changes in observation. New equipment, revised processing, different biological gear and altered spatial coverage can all complicate comparisons. The challenge is to distinguish a real ecological signal from a change in the measuring system without assuming either explanation in advance.
A December 2025 revision of a preprint by Grace Chiu and colleagues develops a model-based approach to reconciling gear-specific fish-abundance indices. Its calibration example uses different camera systems alongside an echosounder, with limited external abundance comparisons. The opened author abstract explicitly describes the scale and limitations of that comparison. It is methodological research, not a validated conversion formula for Pacific hake or every fishery. Chiu and colleagues.
An original toy time series makes the issue concrete. Suppose the underlying quantity stays at one hundred units, but the old observation method records half of it while the new method records three quarters. The observed index rises from fifty to seventy-five without a population increase. Conversely, if the population falls while detection improves, the observed index could remain stable. Without understanding the observation process, either apparent trend could be misread.
The workshop proposes documenting transitions as events in the series. A graph can mark the change in equipment or protocol and provide results under alternative reasonable adjustments. A bridge study can strengthen comparability, but its uncertainty should remain visible. A correction should not be treated as exact merely because software applies it automatically to every historical year.
This perspective protects the value of old data rather than dismissing it. A historical index may remain informative even when its relationship to absolute abundance is uncertain. Consistency can be useful for tracking change, provided the conditions supporting that consistency are examined. The goal is not to demand an impossible perfect census; it is to understand which comparisons the series supports.
Machine learning should be tested where the estimate ends
Automating acoustic classification could reduce repetitive work and make analysis more consistent. But a model that labels acoustic images well under one metric may not produce equally reliable biomass estimates. The downstream calculation weights errors differently from a simple count of correctly labeled pixels or segments. The relevant test should therefore follow the model's output into the survey estimator.
Nils Olav Handegard and colleagues' May 2025 paper does that explicitly for North Sea lesser-sandeel surveys. It integrates several deep-learning classification models with the survey estimation workflow and compares resulting estimates across years. The paper reports variation rather than presenting image classification as an automatic replacement for every scientific judgment. Its data-availability statement describes access on reasonable request, not an unrestricted dataset that this article has independently downloaded. Handegard and colleagues.
The fictional workshop creates a small example. Model A mislabels many weak-signal background cells but correctly classifies the few cells carrying most target backscatter. Model B achieves a higher overall cell accuracy while misclassifying one dense target aggregation. Depending on the estimator, B could have the larger biomass error despite the more flattering accuracy score. The example does not rank actual models; it explains why the evaluation metric must match the scientific use.
A second question concerns independence between training and evaluation. Acoustic segments from the same cruise, place or aggregation can share conditions. Randomly dividing neighboring segments may make the test easier than deploying the model on a different year or survey. A credible evaluation should describe its split and the intended generalization, rather than treating all withheld records as equally demanding evidence.
The workshop's proposed acceptance process therefore reports both classification behavior and the effect on the final estimate. It also retains a path for human review of unfamiliar or high-impact cases. Automation can improve reproducibility while still needing scrutiny. The honest question is not whether humans or machines are inherently trustworthy, but how each source of error is measured and controlled in the workflow.
A controlled experiment is not the entire open ocean
Muriel Dunn and colleagues' 2025 study measured broadband acoustic target spectra for Atlantic cod, polar cod and northern shrimp in single-species mesocosm experiments. The work trained classifiers on those measurements and discusses challenges in scaling toward field classification. The university-hosted published PDF establishes online availability in May 2025, with a June journal issue. Its controlled design is useful evidence for distinguishability under tested conditions, not proof of universal recognition in mixed wild aggregations. Dunn and colleagues.
The fictional workshop treats this as a promising step with a clear next question. Which variations occur in the intended survey that were absent or constrained in the experiment? A system may encounter different sizes, orientations, mixtures, depths or instrument conditions. The purpose of identifying those differences is to design a meaningful field test, not to reject laboratory or mesocosm work because it is not already a global deployment.
A familiar error in technology reporting is to remove the experimental setting from the headline. A classification percentage can then appear to describe every animal in every sea. Keeping the setting attached makes the finding more useful. Readers can see both what has been demonstrated and why a new environment might require additional evidence.
The workshop also distinguishes a classifier's confidence from the probability that its output is correct in a new setting. A strong numerical score can be produced for an unfamiliar input. What matters is how the score behaves under relevant validation, including cases that differ from training. An uncertain or out-of-scope category may be more scientifically useful than forcing every echo into a familiar species name.
The proposed public description accordingly says that a model assists a defined classification task. It does not say that artificial intelligence has counted the entire stock. The latter phrase compresses several unverified steps into one appealing claim. The former leaves room for a real technical achievement without making the achievement carry more than its evidence allows.
Dense schools can challenge the simplest picture
A simple acoustic explanation often imagines sound returning independently from individual fish and being added together. That can be a useful introductory model, but dense aggregations can create more complicated scattering behavior. The interpretation must be appropriate to the physical regime rather than assuming that every bright patch is merely a larger number of identical isolated returns.
A 2020 paper by Benoit Tallon and colleagues, accessed through its author abstract, investigates density estimation in dense fish shoals using acoustic experiments in open-sea cages. It examines multiple scattering and combines that information with observations of individual targets. The work is a specific experimental approach to a difficult regime, not a general calibration for all open-ocean surveys. Tallon and colleagues.
For the fictional workshop, the general lesson is to identify where an approximation is expected to work. A model can be useful across a large part of the dataset and become less reliable in an extreme condition. That boundary should influence quality control and uncertainty rather than being ignored because the same software can process every cell.
The team proposes recording why a region was excluded, treated differently or assigned an additional uncertainty. Exclusions can be scientifically justified, but they can also affect the estimate if the excluded regions contain important biomass. A report should not improve apparent precision by removing difficult data without explaining what the removal means for coverage.
This is another reason to preserve raw measurements. A later method may handle a difficult regime better than the original analysis. If only the final biomass grid survives, the opportunity to revisit the acoustic information may be lost. Preserving the measurement and its processing context allows methodological progress to improve interpretation rather than requiring every question to wait for a new cruise.
One coefficient does not summarize every uncertainty
A survey report may provide a coefficient of variation or another uncertainty statistic. Such a number is valuable only when its scope is understood. It might describe variation under a spatial estimator while leaving other uncertainty components outside that calculation. A reader should not assume that a single percentage includes calibration, species allocation, biological conversion, missing coverage and every model choice unless the methods say so.
The fictional workshop proposes an uncertainty ledger with named components. Some can be quantified directly from the available design; others may be explored through sensitivity analysis or described qualitatively. The ledger should distinguish variability that would change across repeated samples from a systematic shift that could affect all observations in the same direction. Collecting more similar observations may reduce one while leaving the other largely unchanged.
An original toy example uses one hundred independent readings, each with random error around the same mean, plus an unknown calibration offset shared by all readings. Averaging can reduce the random component. It does not make the shared offset disappear. If the reported uncertainty includes only the first component, increasing sample size can create a very narrow interval around a biased value.
The workshop does not propose adding every uncertainty percentage as though all components were independent. Dependencies matter, and different quantities may not be directly combinable. Instead, the first task is descriptive: identify what each reported interval represents and what it leaves out. A careful partial uncertainty statement is better than an apparently complete one assembled from incompatible pieces.
Sensitivity analysis can help by showing how the result changes under alternative reasonable assumptions. It should not be used only to display the preferred estimate's robustness. If a plausible choice changes the conclusion substantially, that is important information for reviewers and decision-makers. The objective is not to make the estimate look immovable; it is to understand where it is supported and where it is conditional.
Survey biomass and stock assessment answer different questions
An acoustic survey produces observations and estimates associated with a survey design and period. A stock assessment combines information through a population model and other assumptions to address broader questions about the stock and its dynamics. These are connected activities, but the survey estimate should not be treated as a direct instruction for how much fish can be caught.
The opening notification makes that distinction explicit for the particular 2025 hake estimate. The warning is not an invitation to ignore an inconvenient observation. It is a statement that using new information responsibly may require reviewing its comparability and its relationship to the assessment. Exclusion from one model run does not make a datum nonexistent, and inclusion without adequate treatment does not automatically make the model more informative.
The fictional workshop explores an invented tension. One dataset suggests many young fish, while another suggests a low total survey biomass. Those observations need not be logically incompatible: many small fish can contribute relatively little mass. Their implications depend on sampling, age composition, growth and the model connecting them. A confident narrative that picks whichever dataset supports a preferred conclusion would miss the scientific problem.
The proposed assessment summary therefore identifies which data entered the model, which did not, and why. It also distinguishes the model's main result from alternative scenarios or sensitivity runs. A scenario is not a forecast simply because it appears in a table. A model result is not a management decision simply because it informs one.
This separation matters to fishing communities and conservation audiences alike. Both need to know whether disagreement concerns observations, interpretation, population dynamics, risk tolerance or policy objectives. Collapsing those layers into a dispute over a single number can make the process look more arbitrary than it is and can hide the specific issue that needs resolution.
Review can be rigorous without promising certainty
The fictional review meeting is most useful when participants can trace a claim back to its inputs. A reviewer asks why a region was assigned to the target species, which biological samples support the allocation and how the spatial estimator treats nearby unsampled water. Another asks how a gear transition affects age composition. A third asks which uncertainty components reach the final interval. These questions are concrete enough to generate evidence rather than simply opposing opinions.
Time limits are real. A review cannot responsibly absorb an entirely changed observation process merely by adding a number to a spreadsheet at the last moment. Equally, time pressure should not become a permanent excuse for avoiding difficult new evidence. The proposed response is a documented path: identify the unresolved question, specify the comparison needed, preserve the data and state how the result will be considered in a later analysis.
The workshop also separates a reviewer's scientific judgment from an operational recommendation. A reviewer may conclude that a particular comparison is not yet supported without claiming the survey should never be used. A manager may need to act under that uncertainty. The record should make clear where scientific inference ends and a decision under uncertainty begins.
For public communication, disagreement should be described at the level where it occurs. A debate about how to adjust a new net is not automatically a debate about whether fish exist in the region. A debate about model structure is not proof that every measurement is unreliable. Precision in describing disagreement helps people understand why science can be both useful and unfinished.
A review process should also be willing to correct its own descriptions. If a headline confuses an index with absolute abundance, the correction should be prominent. If a later calibration changes a historical series, both versions and the reason for change should remain available. Revisions are not inherently evidence of failure; unexplained revisions are what make an evidence chain difficult to trust.
The archive should preserve the route from echo to estimate
An acoustic survey's durable record is more than the final chart. It includes instrument settings and calibration information, vessel tracks, timing, biological samples, classification annotations, processing choices and the versions of software and models used. Not every item needs to be exposed without restriction, but enough context must survive for qualified review and future reinterpretation.
The fictional workshop proposes a reproducibility package organized around transformations. A reader can see how raw signals became cleaned acoustic data, how regions were assigned, how biological information entered, and how estimates were expanded across the survey area. Each transformation has a version and an explanation. This structure is more useful than a folder of files whose relationships depend on one analyst's memory.
Where data access is limited, the limitation should be specific. A paper's statement that data are available on request is not equivalent to a public download that anyone has already verified. Confidential commercial information, logistical constraints or other restrictions may affect what can be shared. The article should report the actual access route rather than claiming complete openness because a paper itself is readable.
The archive also needs to preserve the distinction between original and derived products. A corrected annotation should not erase the original annotation. A revised calibration should not silently overwrite the version used in a published estimate. Keeping both enables a later analyst to reproduce the earlier result and understand why the newer result differs.
This kind of preservation makes long-term monitoring more valuable. Future tools may classify difficult returns more consistently or combine observations in a better model. Their benefit depends on retaining enough information to revisit the earlier evidence. A time series is not only a line on a graph; it is a sequence of documented relationships between the ocean and the measuring system.
What the screen can honestly show
A well-designed survey display can help readers see both the power and the limits of acoustic observation. It can show where sound was measured, where biological samples were taken, which regions were assigned to the target species and where the map relies more heavily on interpolation. It can distinguish a survey index from an assessment output without burying that distinction in specialist terminology.
The fictional workshop's preferred first figure is not a dramatic wall of fish icons. It is a route from echo to inference, with labels identifying the evidence added at each stage. A second figure, where data permit, could show the survey tracks and uncertainty rather than a falsely complete census. An illustrative school of fish can still make a compelling hero image, provided it is labeled as illustration and not presented as an actual echogram or distribution map.
The reader should leave with neither blind confidence nor blanket distrust. Acoustic surveys can observe large regions efficiently and provide indispensable information. Their strength is not that they avoid inference, but that their inferences can be calibrated, checked against biology, compared over time and examined through review.
The fish on the screen are therefore best understood as evidence being interpreted. The final number becomes meaningful when its chain of assumptions is visible and its uncertainty matches the question. That is how a bright return in the water becomes a useful contribution to decisions about a living stock, rather than a misleading promise that the ocean has been completely counted.
Evidence note
Prepared 1 November 2026. The February2026 hake documents describe a dated review and assessment stage, not verified later policy. The scientific-review PDF is identified by its working-draft document title. The seven-team institutional record and the Chiu/Tallon author records were used at abstract level; no full-text or raw-data inspection is claimed for those sources. All workshop scenarios and toy calculations are original hypotheticals. No fishing advice, catch recommendation or live publication is provided.