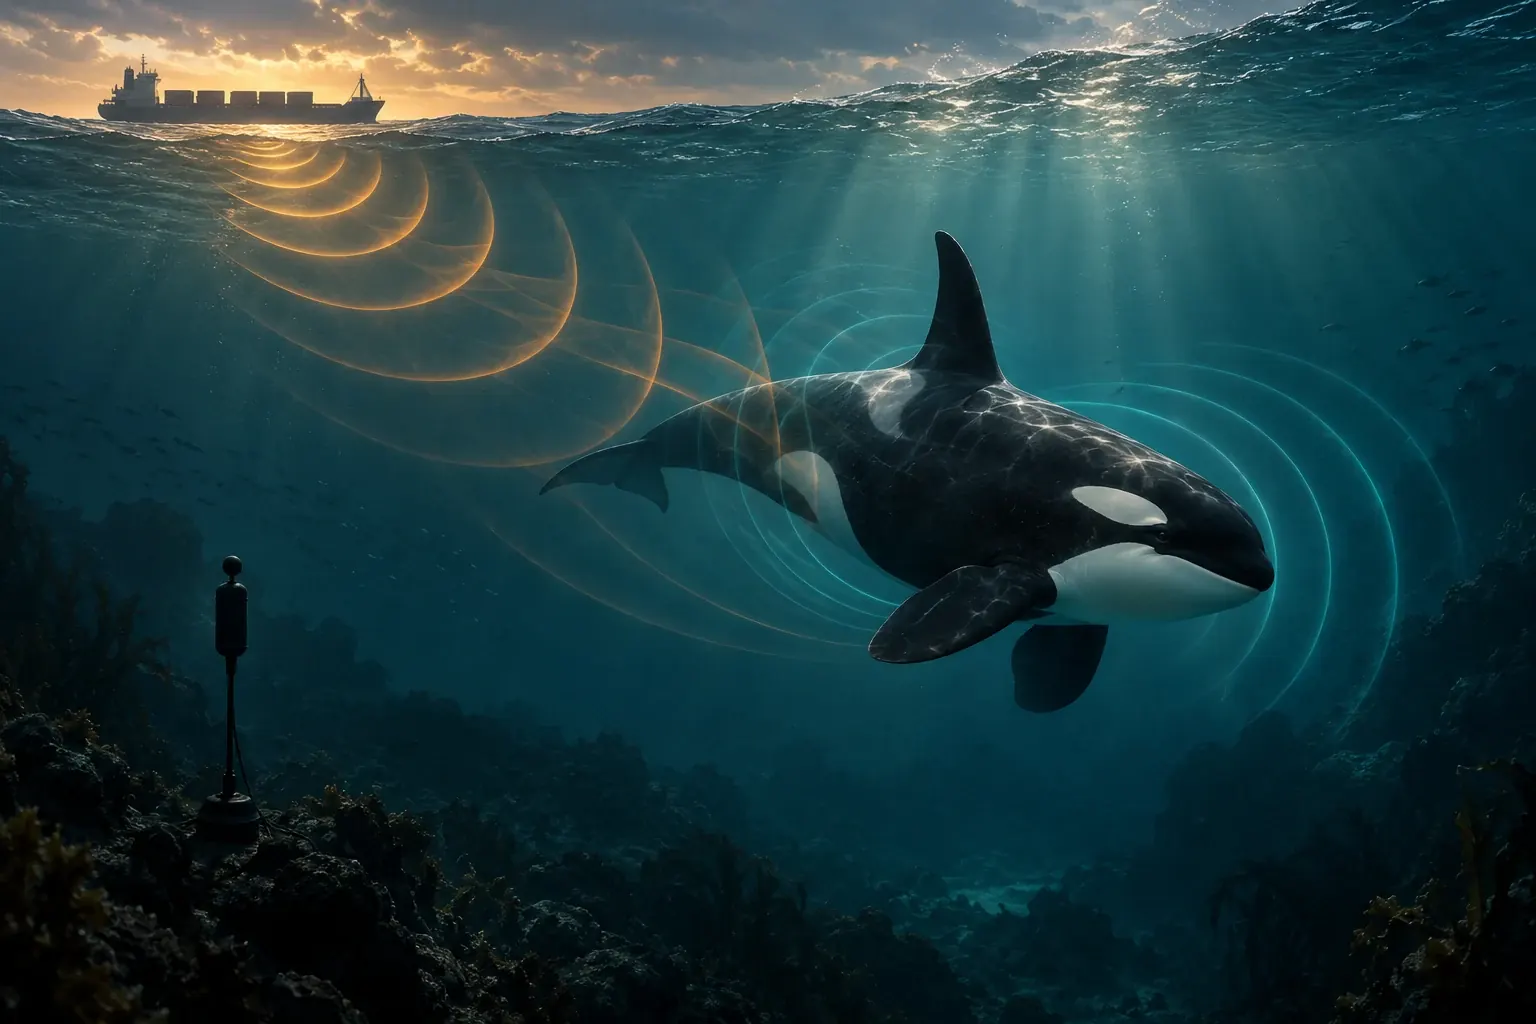
Hearing injury, disrupted communication and changed behavior are different outcomes. Measuring quieter ships is important; proving what animals gain requires another layer of evidence.
The sea can become quieter without becoming quiet
A ship passes beyond the horizon while a recorder on the seabed continues listening. The instrument does not see a vessel's paint, flag or advertised environmental credentials. It records pressure variations at a particular place, across the frequencies and times its hardware can capture. Those measurements can help answer an important question: did a change in human activity alter the underwater soundscape? They cannot, on their own, answer every question about what a whale heard, how it responded or whether its population became healthier.
That gap is not a reason to dismiss acoustic monitoring. It is a reason to make its conclusions more precise. Ocean noise management becomes more credible when a reduction in a measured sound metric is reported as that reduction, rather than quietly upgraded into proof that all ecological harm has been removed. It also becomes more useful when a hearing-injury assessment is not mistaken for an assessment of every way sound can matter.
There are concrete recent developments to examine. Quiet Sound announced on 3 September 2026 that its next voluntary commercial-vessel slowdown would begin the following day in Admiralty Inlet and north Puget Sound. The program described a plan to evaluate the season using vessel information, noise modeling and whale-presence reporting. As of this article's preparation, that announcement is evidence of a program and its intended evaluation, not completed results for the entire 2026–27 season. Quiet Sound announcement.
NOAA's acoustic-tools page, updated in October 2026, also points users to newly posted interim proxy values for coastal pile driving. That is a dated change to an assessment resource, not a declaration that the ocean has a new universal safe-noise level. The proxy sheet distinguishes construction categories and acoustic metrics; its numbers are not interchangeable with a ship's sound at an animal's position. NOAA acoustic tools; October 2026 proxy sheet.
To understand what such developments can accomplish, this article follows an original, fictional coastal monitoring partnership deciding how to evaluate a quieter-shipping initiative. Its invented examples are not measurements from Puget Sound or recommendations for vessel operation. The purpose is to connect several questions that are often collapsed: what made the sound, what reached a receiver, what reached an animal, what function was affected, and what management decision the evidence supports.
Injury is one endpoint, not the whole environment
NOAA's 2024 technical guidance addresses the onset of auditory injury and temporary changes in hearing thresholds. Its scope statement explicitly says that these criteria are one tool within a broader effects analysis, alongside such matters as behavioral disturbance, masking, individual fitness and population assessment. It also distinguishes scientific criteria from the complete regulatory decision. The guidance was finalized in October 2024; an October 2026 tools-page update does not turn the underlying guidance into a newly issued 2026 document. NOAA 2024 technical guidance.
For the fictional partnership, that distinction changes the first public meeting. A participant asks whether sound below an injury criterion is harmless. The scientifically responsible answer is narrower: an injury criterion addresses a particular outcome under its defined conditions. It does not certify that communication, navigation, feeding or behavior is unaffected. Conversely, observing a behavioral response does not automatically demonstrate permanent injury. Each endpoint needs its own evidence and language.
Consider an everyday analogy, used only to explain the distinction. A conversation can become difficult in a noisy room even if the noise does not injure a person's ears. The analogy does not establish what any marine species experiences, nor does it transfer a human threshold underwater. It simply shows why inability to detect an injury is not logically equivalent to inability to detect an effect on a task.
The partnership therefore refuses to put a single green badge labeled safe beside its acoustic results. It proposes separate statements: a measured change in the sound field, an assessment against the applicable hearing criteria where relevant, observations of particular behaviors, and any supported inference about broader consequences. Some fields may remain unanswered. A visible unanswered field is preferable to an answer borrowed from the wrong endpoint.
This separation also prevents the opposite exaggeration. A change in movement is not automatically proof of population decline. A response may be brief or persistent, costly or relatively minor, and its importance may depend on context. The point is not to choose reassuring language over alarming language. It is to name the outcome actually studied and preserve the steps between that outcome and a larger conclusion.
The receiver is not the source
A hydrophone records sound where it is located. A source-level estimate tries to characterize emission from the source using a defined model and reference convention. Those are different quantities. Between a vessel and a receiver lie distance, direction, water conditions, depth, boundaries and other sound sources. A lower recorded level can result from a quieter source, a different path or a changed mixture of contributors.
A September 2025 study by Katrina Johnson and colleagues analyzed commercial-vessel sounds recorded at two stations in the Gulf of Mexico during 2020–22. It combined thousands of transits with ship characteristics and environmental information to investigate source-level variation and predictive models. Vessel speed was influential in that dataset, but the analysis also considered other characteristics. This is a specific observational and modeling study, not a universal equation saying every vessel becomes quieter by the same amount at a given speed. Johnson and colleagues.
Our fictional partnership uses this distinction to avoid a simple error. Suppose the same ship passes the recorder farther away during the initiative than during the baseline. The recorder may register less sound even if the ship's emission has not changed. If the project wants to evaluate source quieting, it needs to account for the passage geometry. If it wants to evaluate sound at that particular location, the changed route may itself be relevant. Neither question is illegitimate, but they are not the same question.
Now suppose the ship is genuinely quieter while a different source becomes louder nearby. The total measured sound may rise. That would not prove the ship intervention failed; it would show that the intervention and the wider soundscape changed differently. A report can acknowledge a reduction attributable to one contributor while also acknowledging that the receiver experienced a noisier overall period.
The proposed reporting format accordingly keeps three layers apart: vessel activity, estimated source characteristics and received sound. It does not require every project to measure everything perfectly. It requires the conclusion to stop at the layer that the evidence can support. This prevents a useful local measurement from being stretched into an unsupported statement about an entire coast.
A percentage needs a denominator and a physical meaning
Noise reductions are often announced as percentages because percentages feel intuitive. But a percentage attached to sound can refer to different things: an intensity-related quantity, a pressure amplitude, time above a criterion, a modeled contribution, or a statistical summary. Without that definition, two impressive claims may be incomparable even before considering different sites and species.
Decibels add another layer because they express a logarithmic ratio. For a simple illustrative comparison of mean-square pressure values using the same reference and conditions, halving the value corresponds to about a three-decibel reduction. It does not mean halving the numerical decibel reading. Nor does it automatically mean that an animal experiences half the disturbance. The arithmetic describes the chosen acoustic quantity, not a universal biological response.
An original toy calculation makes the problem concrete. Let a baseline acoustic-energy index be one hundred units and an intervention value be eighty. That is a twenty-percent reduction in this invented linear index. If another report uses a baseline of two hundred and an intervention value of one hundred and sixty, it also reports twenty percent, but the absolute change and remaining level differ. If the reports use different frequency bands or time windows, even that comparison may be misleading.
The partnership proposes that every public percentage travel with four pieces of information: the quantity, the comparison period, the spatial scope and the statistical operation. Was the result based on the median of short recordings, a time-integrated measure, a modeled vessel contribution, or another metric? These details are not decorative technicalities. They determine what the result means.
The same caution applies to charts. A bar labeled forty-percent quieter may look authoritative while concealing incompatible definitions. A better chart can be simpler: show the exact metric, units, baseline and uncertainty where available. When those inputs cannot be established, a conceptual diagram is more honest than a fabricated numerical comparison. Visual polish should clarify the denominator, not make its absence harder to notice.
The season and the recording window can differ
The August 2025 report on Quiet Sound's 2024–25 slowdown is valuable partly because it exposes a practical monitoring limitation. Its appendix explains that the hydrophone was deployed roughly a month after the slowdown began. It also notes differences between vessel patterns across the full program area and period and the subset near the hydrophone during acoustic monitoring. These are not reasons to discard the report; they are reasons to avoid treating all its observations as if they came from one identical sample. Quiet Sound 2024–25 report.
The fictional partnership faces the same design question before it begins. If a vessel program lasts ninety days but the recorder is operating for sixty, its acoustic coverage is not ninety days. If the missing month coincides with different participation or animal presence, simply scaling up the observed result could be unjustified. The missing interval is part of the study's scope, not merely a footnote about equipment logistics.
A useful original coverage diagram would place the program interval, vessel-data interval, acoustic interval and animal-observation interval on separate rows. Their overlap is the period in which particular joint questions can be asked directly. Outside that overlap, the report may rely on a model or a different observation source. The diagram should make that change visible rather than hiding it in a combined average.
Spatial coverage deserves the same treatment. A recorder near one passage can be highly informative about that passage while being unrepresentative of a distant feeding area. Adding a second recorder may improve the picture, but two locations are still not continuous coverage of every place an animal travels. An array design is a sampling strategy, not a declaration that the whole sea is now observed.
The partnership's proposed pre-analysis document therefore names the primary area and period before the results are known. Additional analyses remain possible, but they are labeled as additional. That reduces the temptation to select whichever combination produces the most impressive reduction. It also makes a modest result easier to trust because the reader can see that the question did not move to fit the answer.
Masking can affect a task without silencing the animal
A March 2025 study by Line Hermannsen and colleagues tested two trained porpoises performing an echolocation target-discrimination task under different noise conditions. In the higher masking condition, the animals increased aspects of their acoustic effort but still performed worse; changing the noise-source geometry allowed performance to recover. The opened abstract supports a specific experimental masking result. It does not establish a universal population-level loss for wild porpoises exposed to every vessel. Hermannsen and colleagues.
This is an important kind of evidence because simply hearing an animal continue to produce clicks does not prove that its task remains unaffected. A signal can still be produced while its useful return or reception becomes harder to interpret. The relevant outcome may concern success, effort, timing or the spatial arrangement of competing sound, not just whether vocal activity is present.
For the fictional partnership, this changes how a recording is described. A track containing animal sounds during vessel passages is evidence that those sounds were detected at the recorder. It is not automatic evidence that the animals communicated or foraged normally. Equally, a recording without detected calls does not prove that animals were absent or unable to vocalize. They may have been silent, distant, obscured or outside the instrument's effective coverage.
An original task-based diagram can help readers. It shows a source signal, a path, an intended receiver or target return, competing sound and a defined task outcome. The diagram does not assign a universal threshold. Instead, it asks which link the study actually measured. A sound-pressure result belongs to one link; a controlled discrimination result reaches another; a population model extends farther and introduces additional assumptions.
A compensatory response is an observation, not a guarantee of restored function. The evaluation should report the task outcome separately.
Vessel count is not a complete exposure measure
It is tempting to count boats because boats are visible and countable. Yet two vessels do not necessarily create twice the biologically relevant exposure of one, and one loud vessel need not resemble two quieter vessels. Their emissions, positions, timing and interactions with the environment matter. A count can be a useful management indicator without being a complete acoustic dose.
A 2024 study by P. Arranz, R. De la Cruz-Modino and K. R. Sprogis compared short-finned pilot-whale behavior during specified vessel approaches off Tenerife. The study contrasted two lower-source-level vessels with a louder single vessel and reported differences in the measured behavioral responses. The opened abstract describes a particular whale-watching scenario and mother-calf observations; its suggested level should not be exported here as a universal safe threshold or permission to approach wildlife. Arranz and colleagues.
The partnership draws a limited inference: vessel numbers and acoustic characteristics should not be silently substituted for one another. If a program reports fewer passages, it has reported an activity change. To establish the corresponding sound change, it needs acoustic evidence or a sufficiently qualified model. To establish a biological benefit, it needs an additional line of reasoning or observation.
A fictional example illustrates why. On one day, ten relatively quiet passages occur while animals are elsewhere. On another, five louder passages overlap a concentrated feeding period. The count declines, but the relevant exposure could increase. The example supplies no real species response or management threshold. It merely demonstrates that fewer events is not logically enough to establish lower impact when event characteristics and animal overlap also change.
The converse is equally important for fair evaluation. A port could maintain the same number of passages while reducing sound from the vessels that contribute most in the relevant band and location. A boat-count-only dashboard could miss that improvement. Choosing the indicator should follow the question, not just the ease of collecting a number.
Behavior, physiology and population are separate steps
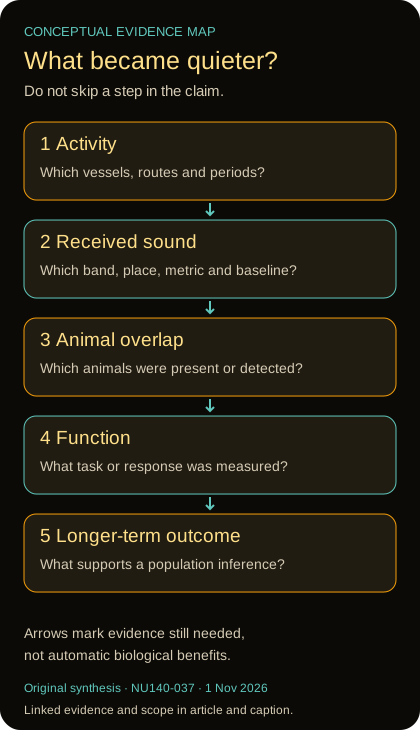
Original conceptual evidence map, 1 November 2026: activity, received sound, animal overlap, measured function and longer-term outcomes are separate questions. No numerical data or automatic causal progression is asserted.
A well-known 2012 paper by Rosalind Rolland and colleagues examined a reduction in shipping noise in the Bay of Fundy after September 2001 alongside stress-related hormone measurements in North Atlantic right whales. The authors reported an association between the quieter period and lower baseline stress-related metabolites. This was an unusual observational opportunity, not a randomized experiment assigning ocean noise to wild whale populations. It provides physiological evidence with a specific design and context. Rolland and colleagues.
A November 2025 paper led by L. M. Martín López examined changes in swimming gait during sonar-exposed and unexposed dives across four beaked-whale species. It connects observed movement patterns to a proposed physiological interpretation and discusses possible consequences. The observed gait changes should be distinguished from hypothesized downstream mechanisms; the study does not turn every sound exposure into a demonstrated stranding event. Martín López and colleagues.
These studies reach beyond a hydrophone reading, but they still do not make every link in the ecological chain interchangeable. Movement, task performance, hormone measures, energy expenditure, reproduction and survival are different observations or modeled outcomes. A persuasive account can explain why one may matter for another while being clear about which transition has direct evidence and which remains an inference.
The fictional partnership proposes an evidence ladder rather than a single impact score. The first rung concerns the sound field. The next concerns exposure of animals in the relevant place and time. Further rungs concern specified responses, functional consequences and longer-term outcomes. A project can make meaningful progress on the lower rungs without pretending it has reached the top. Conversely, uncertainty about the top does not make the lower evidence meaningless.
This is not a demand to wait for perfect population data before taking any action. It is a demand to state the basis of action accurately. A precautionary decision can be justified as precautionary. A demonstrated local reduction can be celebrated as demonstrated. The communication failure occurs when those different justifications are blurred into a claim that the complete causal chain has already been measured.
A model can fill gaps without becoming a microphone
The May 2026 ShipEcho preprint describes a web-based approach to mapping vessel noise using vessel-position data, source models and propagation calculations informed by bathymetry. Its author abstract reports comparisons with acoustic recordings and explains that sparse direct measurements motivate the mapping approach. This article uses the opened abstract only; it does not claim to have independently validated the software or inspected every result in the full manuscript. ShipEcho author preprint.
For the fictional partnership, such a tool represents a useful category of evidence. A model can estimate conditions between recording sites, compare scenarios and identify where additional measurements would be valuable. But a modeled cell should not be displayed as though a hydrophone directly measured it. The distinction is especially important when a map's smooth colors imply a spatial completeness that the observations do not possess.
The proposed map uses separate visual treatments for observations and estimates. It states the time window, frequency band and modeled source classes. It also identifies areas where input coverage is weak or the environmental assumptions are uncertain. This does not require a map covered in warnings. It requires a legend that lets a reader understand what kind of object is being viewed.
Validation needs a similarly precise question. Agreement at one recorder during one period can support the model for those conditions. It does not automatically establish equal performance in another season, depth range or vessel mixture. Holding out some observations from calibration can provide a more informative test than evaluating only against the data used to tune the model, although the appropriate design depends on the actual dataset.
The partnership also asks whether the model's error matters for the decision. A rough estimate might be adequate for choosing where to deploy another recorder, yet inadequate for claiming a small improvement between two policies. Models do not need to be perfect to be useful. They need to be used at a level of precision that their evidence can support.
The animal's calendar changes the meaning of a quiet hour
A soundscape average treats time as a sequence of intervals, but ecological relevance may vary across those intervals. A quieter period when the animals of interest are absent is not equivalent to a quieter period during a concentrated feeding opportunity. Neither is automatically worthless; the question is which outcome the initiative aims to improve.
The fictional partnership therefore proposes reporting acoustic change and animal overlap separately before combining them. Observed presence may come from visual reports, passive acoustic detections or another defined method. Each method has limits. A detection is positive evidence under the method's conditions; a non-detection needs interpretation in light of effort, visibility, vocal behavior and instrument coverage.
Consider an invented example with ten monitored hours. Sound is lower in eight hours and unchanged in two. If animals were observed only during the two unchanged hours, a claim about improved conditions during observed animal presence would not follow from the eighty-percent time statistic. If animals were present during the quieter hours, the overlap would be more relevant, but the sound change would still not by itself measure feeding success.
This simple exercise shows why an average can be technically correct and poorly matched to the management question. It also illustrates why choosing a biologically relevant season in advance can be sensible. The analysis should still acknowledge uncertainty in timing and presence rather than pretending that animals follow a fixed schedule.
The partnership's proposed report includes a joint coverage table: acoustic observations available, vessel information available, animal observations available, and overlap among them. The table is not a scorecard of good and bad days. It tells the reader where a combined claim is directly supported and where the argument depends on interpolation, modeling or cautious inference.
A quieter passage may last longer
Operational changes can affect several dimensions of exposure at once. A reduction in instantaneous sound does not necessarily imply the same proportional reduction in a time-integrated measure if the duration also changes. This is a mathematical point about the chosen quantity, not a claim that slowing vessels is ineffective or that a particular alternative is preferable.
In an original simplified example, suppose a source contributes an invented linear acoustic-energy rate of ten units for one unit of time, yielding ten accumulated units. Another scenario contributes six units for two units of time, yielding twelve. The second is lower at each instant in this model but higher when integrated over the specified duration. Real moving sources, propagation and animal responses are more complex, so this arithmetic is not a vessel-noise prediction.
The example explains why reports should distinguish peak, average, duration and cumulative exposure. Different outcomes may be sensitive to different aspects of the sound. A reduction in one metric can be valuable even when another changes less, but the report should not imply that every metric moves together by the same percentage.
There may also be intervals of relief between passages, and the pattern of those intervals may matter for a particular task. Two soundscapes with the same daily integrated value can arrange that value differently in time. One might contain concentrated events and longer quieter gaps; another a more continuous background. Whether that difference matters biologically requires species- and context-specific evidence, not an assumption from the arithmetic alone.
For the fictional partnership, the practical response is to preselect metrics that reflect the intended question and to retain enough temporal detail for secondary analysis. It would be a mistake to reduce the raw record to one daily number and then discover that the important question concerns interruptions lasting much less than a day. Data reduction is useful, but it should not erase the structure needed to evaluate the intervention.
Baselines are choices, not neutral scenery
Every before-and-after result depends on what counts as before. A baseline can differ from an intervention period in weather, traffic composition, seasonal biology, recording conditions or unrelated human activity. Observing a difference does not automatically identify which of those changes caused it. This is a familiar inference problem, but it becomes easy to overlook when the intervention has an appealing purpose.
The fictional partnership proposes several checks before attributing a quieter recording to its program. Was the same equipment used in the same configuration? Were the compared frequency bands and analysis windows identical? Did the mix of vessel types change? Were there unusual sources in one period? Which covariates can be measured, and which cannot? A report that answers these questions is stronger than one that simply presents a larger percentage.
An original numerical example separates relative success from absolute trend. Imagine that the background index would have risen from one hundred to one hundred and thirty without the intervention, while the observed intervention value is one hundred and ten. Under that hypothetical counterfactual, the intervention reduces the value by twenty relative to the no-intervention scenario, even though the observed value is ten above the old baseline. The counterfactual is invented here; a real report would need evidence for it.
The example helps prevent a false binary. A program can plausibly reduce one contribution while the wider environment worsens for other reasons. Alternatively, a quiet period can occur without the program being its main cause. Evaluating the intervention and describing the environmental trend are related but distinct tasks.
The partnership therefore wants both a transparent observed comparison and an explicitly qualified causal analysis. If the available design cannot separate all explanations, the conclusion should say so. Honesty about attribution does not diminish the value of monitoring; it identifies what future study design could improve and prevents a fragile success claim from undermining an otherwise useful effort.
The dashboard should not reward selective listening
A public dashboard can make a technical program understandable, but its design can also encourage selective reporting. If the only visible number is the largest reduction found in any band or period, readers may mistake a best case for the overall result. If only a broad average is shown, an important local or frequency-specific change may disappear. Neither choice is neutral.
For the fictional partnership, the proposed first screen contains a plain-language question, a clearly named primary metric and a short statement of what that metric does not establish. A second layer shows the recording locations, dates and missing intervals. A third provides the methods and alternative metrics. The structure allows a quick reader to learn the main result without hiding the evidence from a more demanding reader.
Color should distinguish categories, not substitute for them. Observed and modeled values need labels as well as different colors. A missing recording should not share the same color as a low sound value. A map cell outside the model's domain should not look like a quiet refuge simply because the software has no estimate there. These are interface decisions with scientific consequences.
The dashboard should also preserve version history. If calibration information or an analysis method changes, the revised result can be published without erasing the earlier one. Readers should be able to tell whether a trend changed because the ocean changed, the dataset expanded or the method was corrected. A change log is more useful than an unexplained replacement of last month's chart.
Finally, the dashboard needs to resist ranking unlike programs by a single headline percentage. Different baselines, frequency bands, vessel populations and monitoring windows can make such a league table misleading. A comparison page can still be useful if it presents those differences explicitly. The goal is to help communities learn from one another, not to manufacture a winner from incompatible denominators.
Choosing action without pretending uncertainty has vanished
The fictional partnership ultimately has to decide what to do, not merely list caveats. It can distinguish actions whose benefits can be evaluated soon from broader outcomes that require longer observation. It can set a monitoring plan, define what would count as improvement and state in advance what evidence would trigger reconsideration. Uncertainty becomes part of the decision design rather than an excuse for either paralysis or overconfidence.
The costs and constraints also deserve explicit treatment. An operational proposal may interact with navigation safety, scheduling, port coordination and other environmental objectives. This article does not provide sailing instructions or determine legal compliance. The people responsible for those decisions need the relevant authorities and technical expertise. A scientifically credible noise initiative should not conceal tradeoffs merely because its conservation aim is worthwhile.
A useful decision record would identify the chosen outcome, the intervention, the expected mechanism and the evidence needed to evaluate that mechanism. If the near-term goal is a lower measured contribution from selected vessels in a defined area, say that. If the longer-term goal is improved opportunity for a particular animal function, explain which additional observations would connect the two. This makes progress visible without claiming that every endpoint has already been achieved.
The record should also allow an intervention to be refined. A weak result might reflect low participation, an unsuitable monitoring window, an inaccurate source model, or an intervention that does not substantially change the relevant sound. Those possibilities call for different responses. Treating every disappointing result as either proof of failure or proof that more time is needed prevents learning.
The strongest public-interest conclusion is therefore not a single reassuring number. It is a disciplined chain: a documented action changed a specified aspect of the soundscape; that change overlapped a relevant place and time; evidence indicates how a particular biological function may benefit; the remaining uncertainty is visible. Each link can be strengthened without pretending the others are already complete.
Preserving a recording is not preserving its meaning
The fictional partnership also needs a durable archive. A sound file without information about the recorder, calibration, sampling settings, deployment depth and clock can be difficult to interpret later. A future analyst may be able to play it while being unable to reconstruct the physical quantity behind its amplitudes. Audible playback is not a substitute for calibrated analysis, and a louder laptop speaker does not make the original ocean louder.
The proposed archive therefore keeps the original files alongside a description of processing steps. Filtering, clipping detection, exclusions and aggregation are recorded so that a later reader can distinguish the raw observation from a derived product. If a short public audio excerpt is prepared for accessibility or engagement, it is labeled as an excerpt with any playback adjustments disclosed. It should not be presented as a faithful simulation of another species' hearing.
Location information may also need thoughtful handling when it concerns sensitive wildlife observations. Public accountability does not necessarily require publishing every precise animal location in real time. The partnership can describe the evidence and its coverage while following appropriate protections and permissions for the underlying observations. That decision should be documented rather than hidden behind a vague claim of open data.
These archival choices make the initiative useful beyond its first announcement. Future methods may ask questions the original team did not anticipate. Preserving enough context allows those questions to be investigated without pretending that a recording contains information the instrument never captured. The archive is therefore part of the scientific result, not merely the storage bill left after the report is finished.
What a quiet-ocean claim should let you ask
When the next headline says a port, vessel or policy made the ocean quieter, the reader should be able to find a few concrete answers. Quieter in which acoustic quantity and frequency band? At which receiver or across which modeled area? Relative to which baseline? Over what duration? With which animals observed, and through which method? These questions make a result more interpretable rather than automatically more doubtful.
The same reader should be able to distinguish hearing criteria from the complete ecological assessment, a controlled task experiment from a field population study, and a model from a continuous measurement network. Those distinctions are not obstacles to conservation. They prevent good evidence from being asked to carry a conclusion it cannot yet support.
The recent tools, experiments and voluntary programs discussed here show a field developing several kinds of evidence at once. Their value is not that one has finally supplied a universal number that makes every marine sound problem simple. Their value is that they allow more specific questions about sources, propagation, hearing, behavior and management to be investigated.
A quieter ocean is a meaningful ambition. The measurements become most useful when quiet is treated not as a vague label but as a carefully described change in conditions that matter. The task is to make those changes real, to verify them at the right scale, and to remain honest about what the animals' lives have and have not yet told us.
Evidence note
Prepared 1 November 2026. Linked primary research, official guidance and original program reports are distinguished from hypothetical analysis. PubMed research summaries and the ShipEcho author abstract were read at abstract level; they are not represented as complete-paper inspections. NOAA guidance scope and the Quiet Sound report's monitoring-window limitation were checked in the original PDFs. No animal approaches, experiments, vessel operations, publication or indexing were undertaken.