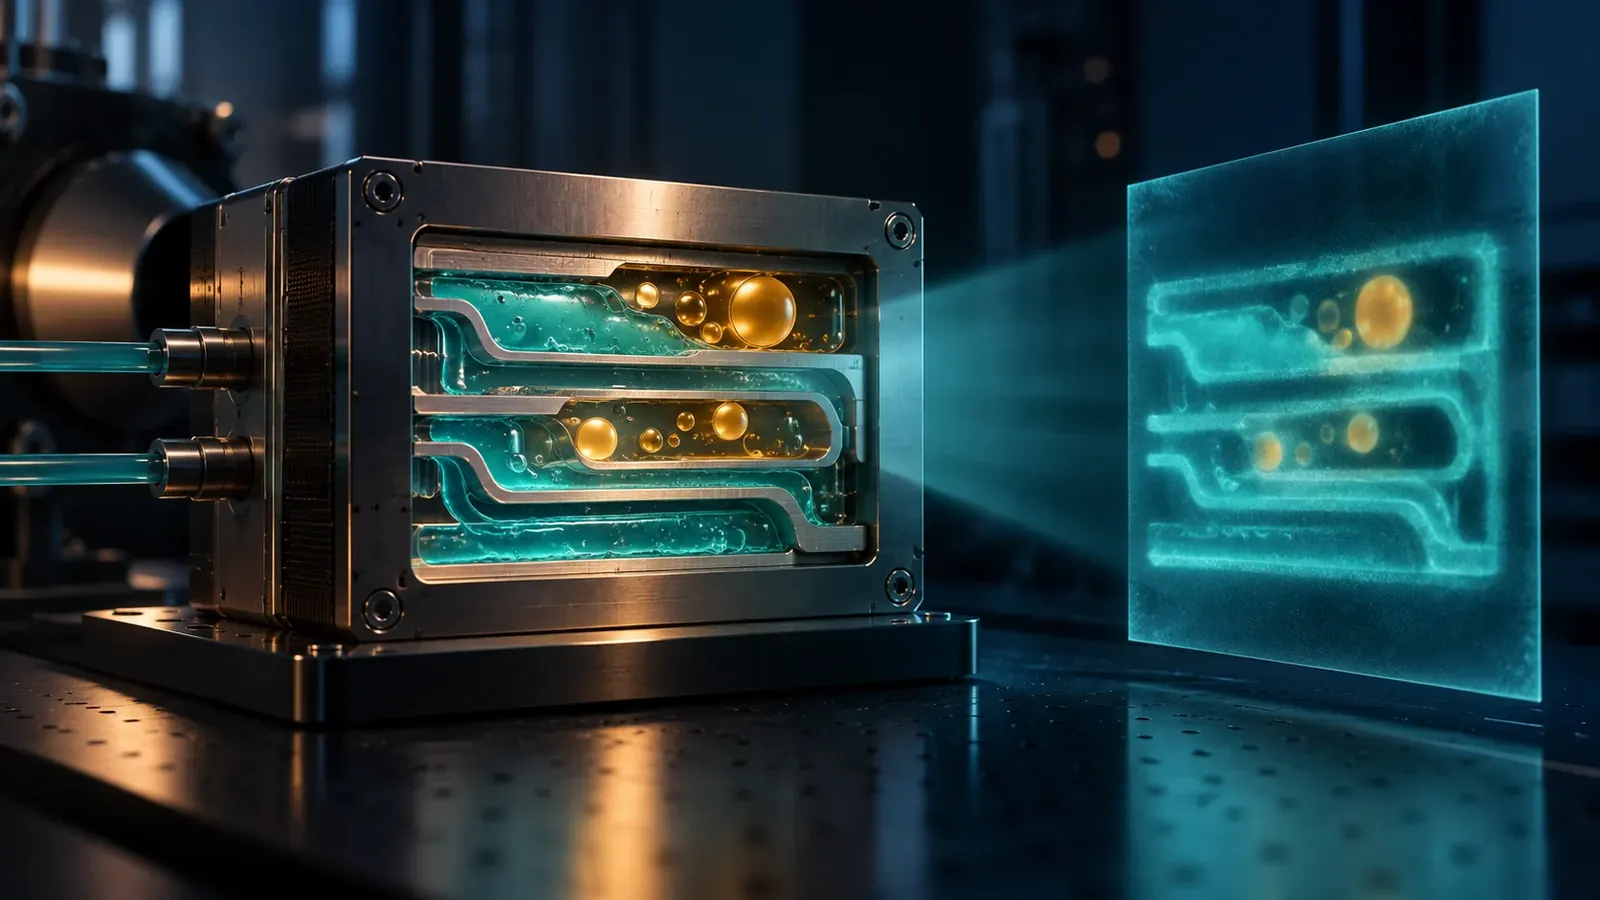
Neutron imaging can expose hidden liquid, gas and magnetic changes in energy devices. Its strongest results come from choosing a contrast mechanism that answers a specific question.
A battery can report its voltage while concealing where a reaction is occurring. A fuel cell can lose performance while leaving several plausible explanations for the decline. The useful question is often spatial: where did liquid accumulate, where did a gas pocket form, or which part of an electrode participated in the reaction? Opening the device afterward may remove the conditions that produced the answer.
On July 28, 2026, Gimenez-Garcia and colleagues published a neutron-imaging study that combined polarization and transmission measurements in a laboratory all-iron flow battery. The two measurement modes helped distinguish deposited ferromagnetic iron from gas-related changes during operation. The result is a particularly clear example of choosing different physical contrasts for different parts of the same problem, rather than expecting one grayscale image to identify everything inside a device. Polarization contrast imaging of iron plating
Neutron imaging is valuable partly because it can make some hydrogen-containing materials conspicuous within hardware that is difficult to examine with ordinary light. But sensitivity is only the beginning. An observed change still needs a defensible interpretation. More liquid, different composition, a different path length, or an altered magnetic state can be different answers to superficially similar visual questions.
The following account focuses on operating energy devices, where this interpretive challenge becomes practical engineering. It examines how researchers connect images with electrical behavior, how complementary measurements reduce ambiguity, and why a specially designed test cell must be understood before its images are generalized. All numerical teaching examples are invented and simplified; none is an operating recipe for neutron equipment, battery construction, or chemical handling.
The device tells a total, but the image asks where
An electrical measurement can summarize the behavior of a whole device. That is precisely why it is useful for operation and precisely why it can leave a spatial question unresolved. Two devices can produce similar overall readings while distributing their internal activity differently. One may operate relatively evenly; another may rely heavily on a small region while the rest contributes little.
Consider an original arithmetic example with four equally sized regions. In one hypothetical device, each region contributes twenty-five units to a total of one hundred. In another, the contributions are seventy, ten, ten, and ten. The total is identical. The internal distribution is not. If a design change affects the heavily used region, the second device may respond very differently even though its starting total looked ordinary.
An image can help distinguish such possibilities, but it must measure something relevant to the contribution. A picture of material distribution is not automatically a map of local current. A gas pocket may be associated with a performance change without explaining the entire change. The experiment becomes stronger when its spatial measurement is connected to other observations through an explicit argument.
This is the appeal of operando research: observe a system while it performs the process under investigation and relate the observation to its behavior. The term should carry information about the actual conditions, not simply act as a badge of realism. A laboratory cell operating under controlled conditions can be operando without reproducing every feature of a commercial device.
For readers, the first useful question is therefore modest and concrete: what was running, what was being measured, and what changed together? Establishing those three facts provides a foundation for understanding the experiment. Starting instead with a promise that researchers can finally see everything inside a battery encourages an interpretation that no single measurement is likely to support.
Contrast is a relationship between a probe and a specimen
A material is not universally opaque or transparent in every kind of imaging. Its appearance depends on how the selected probe interacts with it, how much material lies along the path, and which part of the transmitted or scattered signal the apparatus records. Neutrons offer a different set of interactions from X-rays, which can make the two methods complementary rather than competitors for a single imaging crown.
NIST's Advanced Neutron Imaging Facility account describes a dedicated beamline with collimation, filtering, a sample position, a neutron camera, and an X-ray system arranged for complementary measurements. The page was updated on March 26, 2025; that is a documentation date, not the date neutron imaging was invented or a guarantee of present scheduling availability. It also makes clear that the apparatus belongs in a controlled research facility, not an improvised workshop. NIST Advanced Neutron Imaging Facility
The important conceptual shift is from asking whether a device is visible to asking which internal differences will produce measurable contrast. A component can be clearly outlined while the change of interest remains too small to distinguish. Conversely, a modest-looking image may reveal the particular liquid movement that matters to a design decision.
An invented comparison makes the distinction easy to see. Imagine two liquids that produce almost the same response in one measurement mode but different responses in another. The first mode may be excellent for locating the container and poor for distinguishing the liquids. Calling it a bad image would miss the point. It answers a different question.
The same reasoning applies to the object around the liquid. A housing selected for mechanical performance can complicate a particular measurement. Replacing it with a more favorable test housing may improve visibility while also changing the system. The experimental task is to understand both consequences, rather than treating improved contrast as a free improvement with no interpretive cost.
Water can help one process and obstruct another
The engineering interest in water distribution is not a simple desire to remove every drop. In an electrochemical device, the effect of water depends on where it is, how it moves, and what the device needs to do. A useful imaging experiment therefore connects a location with a function instead of assuming that a darker or wetter region is inherently bad.
Sarker and colleagues' 2025 study, available through NIST's complete author abstract, combined modeling and neutron radiography for a particular anion-exchange membrane fuel cell. It reported strong sensitivity to relative humidity and linked anode-side flooding with reduced performance under the investigated conditions. The accessible evidence supports that specific account, not a universal statement that every fuel-cell chemistry transports water in the same direction or fails by the same mechanism. AEMFC operating conditions and liquid-water transport
A helpful original analogy is a city with several kinds of routes. Adding traffic to an empty road may improve access to a destination. Adding the same traffic to a blocked intersection may make access worse. The total number of vehicles is insufficient to describe the situation; their locations and the network's purpose matter. Water inventory and water distribution pose an analogous distinction, without making a fuel cell literally equivalent to a road system.
Suppose two hypothetical devices contain the same total liquid volume. In one, the liquid occupies a region that supports the intended transport. In the other, it occupies a region that blocks access to a reaction site. A measurement of the total would miss the operational difference. A spatial measurement may reveal it, provided the image can distinguish the relevant regions.
This is why a research paper's component labels deserve attention. A conclusion about liquid in a channel is different from a conclusion about liquid within an electrode or membrane. If the measurement cannot separate those locations, the interpretation should say so. A precise inventory assigned to the wrong compartment can be less useful than a less precise result with a defensible location.
One viewing direction can combine several compartments
A radiograph records information along paths through an object. Different parts can overlap in the same projected location. For a working device, this can combine contributions from components that perform different roles. The apparent simplicity of a flat image therefore conceals a question about depth.
Imagine three transparent sheets carrying different marks. Viewed together, the marks may overlap. A change on the front sheet and a change on the back sheet can alter the same region of the combined picture. This original illustration explains the attribution problem without claiming that neutron transmission is identical to ordinary visual transparency.
Ziesche and colleagues' 2022 study developed time-resolved neutron computed tomography for water dynamics in a bespoke polymer electrolyte fuel cell. Its purpose included separating spatial water distributions that projection imaging can combine. The study used a specially designed mini-cell and a particular balance of acquisition speed and image quality; it does not establish that every full-size device can be scanned with the same temporal and spatial performance. High-speed four-dimensional neutron imaging
Tomography adds viewing directions to address depth, but the extra measurements take place over time. If the object changes during that interval, the reconstructed volume must be interpreted with that acquisition history in mind. A displayed three-dimensional frame is not necessarily an instantaneous state captured everywhere at once.
The decision between a faster projection sequence and a slower volumetric sequence therefore depends on the question. A projection may be sufficient to track a large event at a known location. A volume may be needed when overlapping compartments would otherwise make the answer ambiguous. Neither choice is automatically more scientific; the stronger choice is the one whose limitations are compatible with the intended inference.
The time stamp on a frame can be misleading
Consider an invented device in which a bubble forms, moves, and disappears over two seconds. A measurement that averages over ten seconds may record only a diluted trace of that event. A measurement that records every tenth of a second may reveal its progression, but each short exposure has less time to accumulate signal under otherwise comparable conditions.
This example is deliberately generic. It is not a performance claim for a cited beamline. Its purpose is to distinguish the duration of an event from the interval over which a measurement collects information. A video can play smoothly even when its frames summarize events more coarsely than the viewer assumes.
A useful caption should therefore identify the relevant acquisition interval, not merely the playback rate. Speeding up a sequence for presentation is often helpful, but the time scale must remain recoverable. Otherwise, a slow redistribution can look like a sudden instability, or a brief interruption can appear to persist.
The same issue affects correlations with electrical measurements. Suppose voltage is recorded rapidly while images are acquired over longer intervals. Assigning one voltage value to each image can conceal variation within that interval. A careful analysis asks how the two streams were synchronized and which summary of the faster stream is appropriate.
The broader lesson is that time resolution is part of the measurement's meaning. It is not simply a number to maximize. A study of long-term redistribution may not need to resolve every rapid fluctuation. A study of transient blockage may require precisely that capability. The event of interest should determine what the sampling must preserve.
More counts can help, but averaging can erase the event
An elementary counting model offers a way to reason about this trade-off. Assume, only for an original teaching exercise, that independent detected counts follow a Poisson process and that other errors are absent. The standard deviation is then the square root of the count, so relative counting uncertainty is approximately one divided by that square root.
With one hundred counts, the ideal relative uncertainty is about ten percent. With ten thousand counts, it is about one percent. Achieving one tenth of the relative uncertainty in this simplified model requires one hundred times as many counts, not ten times as many. Real instruments add complications, but the arithmetic explains why improved precision can be expensive in acquisition time or signal collection.
Now imagine collecting those extra counts while the feature moves. The statistical average may become more stable while the image becomes less representative of any one position. Precision about a time-averaged signal is not the same as precision about a fast event. An experiment needs to decide which quantity it intends to estimate.
A second option is to combine neighboring pixels. That can improve a regional estimate while sacrificing information about small spatial differences. If a local hotspot occupies only a small fraction of the combined region, its effect can be diluted. The averaging rule should therefore be chosen with the scale of the hypothesis in mind.
These calculations do not prescribe an exposure or detector setting. They provide a vocabulary for evaluating a claim. When a paper reports both rapid acquisition and small differences, ask how the signal was accumulated, what was averaged, and which sources of uncertainty remain. The answer may be excellent; the point is to identify the reasoning rather than infer it from a smooth color map.
Magnetic contrast adds a different question
The 2026 iron-flow-battery study is especially instructive because it did not rely solely on ordinary transmission. Polarization contrast responds to magnetic behavior, allowing the researchers to target deposited ferromagnetic iron under their conditions. Their calibration and discussion also identify limits, including signal saturation and the distinction between magnetic iron and other iron-containing species. More iron-containing material does not necessarily mean a proportionally stronger response in that channel. Calibration and limitations of polarization contrast
This is a general lesson in selective measurement. A method can become more informative by deliberately ignoring some things. The selectivity is useful when it aligns with the question and dangerous when a reader forgets what has been excluded. A magnetic map should not quietly become a complete elemental inventory.
An original thought experiment uses two boxes with equal total iron content. In one, the iron occupies a state that produces the selected magnetic response. In the other, it does not. A difference in the magnetic measurement would not imply that the boxes contain different total amounts of iron. It would indicate a difference in the property to which the measurement is sensitive.
This distinction is valuable in reaction studies because chemical and physical state can matter as much as elemental presence. A device may retain an element while converting it into a form that no longer performs the intended role. A measurement designed to distinguish states can therefore answer a question that a simple total cannot.
Two measurements can separate what one leaves ambiguous

Original idealized algebra analogy for complementary information; not a calibration or empirical response model.
Shrestha and colleagues combined neutron and X-ray tomography to examine spatial heterogeneity in electrochemical devices, including membrane hydration and deformation in an operating fuel cell. The paper first appeared online on October 25, 2025, although it belongs to a 2026 journal volume. Its central methodological contribution is the correlation of complementary information about material distribution and geometry, not a claim that an image alone improves device lifetime. Correlative neutron and X-ray tomography
An original algebra example shows why complementary signals can help. Suppose two unknown quantities are called A and B. One idealized measurement reports A plus B equals ten. Many combinations satisfy it: two and eight, five and five, or nine and one. The measurement is perfectly precise and still cannot identify both quantities separately.
Now add a second independent measurement that reports A minus B equals four. Combining the two equations gives A equals seven and B equals three. The extra information resolves the ambiguity in this invented example. It does so because the second measurement responds differently, not simply because it produces another image.
Real multimodal experiments are more complicated. Responses may be nonlinear, uncertain, correlated, or affected by additional unknowns. Nevertheless, the example identifies a useful question: what ambiguity does the second modality reduce? If both measurements respond in nearly the same way to the same mixture, two images may add much less information than expected.
The measurements must also refer to corresponding parts of the specimen at compatible times. Combining beautifully resolved images of different states can create a misleading interpretation. Complementarity is a property of the full experimental design, including alignment and timing, rather than a benefit automatically granted whenever two instruments appear in the same paper.
A bubble can brighten the image while the device gets worse
In some measurement configurations, a gas-filled region can transmit more neutrons than the liquid it replaces. That does not make a brighter region a universally positive sign. Display brightness is a measurement convention, while improved performance is an engineering judgment. Confusing the two is easy when a visual presentation uses bright colors for attractive-looking features.
Bozzini and colleagues' 2026 study combined X-ray and neutron methods for particulate zinc electrodes, including neutron radiography of gas evolution during self-discharge. Its static comparisons and dynamic observations were not all performed in the same specimen state: the methods describe draining, rinsing, and drying for a discharged-state tomography preparation. This distinction prevents a reader from treating every displayed volume as an untouched operating cell. Particulate zinc electrodes examined with complementary probes
For a hypothetical engineering decision, imagine that a bright region grows while current falls. The correlation suggests a question, not a complete answer. Is the region a gas pocket blocking access? Has liquid moved elsewhere? Does another change influence both the image and the current? A useful follow-up separates these possibilities instead of assigning a mechanism solely from the color sequence.
The lesson also applies to image differences. Subtracting a reference can emphasize small changes, but the sign of the difference depends on the subtraction convention and the underlying contrast. A red region might mean increased transmission, decreased attenuation, or a chosen visualization of a derived quantity. The legend needs to say which.
A well-designed figure therefore explains the direction of the physical response before asking the reader to interpret the pattern. This is not a cosmetic concern. Reversing the meaning of a difference image can reverse the proposed mechanism while leaving the picture visually unchanged.
A custom cell creates both access and a new comparison
Campillo-Robles and colleagues developed a neutron-friendly lead-acid test cell for a study published in 2019 and deposited on arXiv in January 2025. Their accepted manuscript describes design changes and transmission simulations, and concludes that ordinary electrolyte concentration changes were difficult to observe with the available contrast, although electrode-related changes were detectable. The later repository date should not turn this into a newly invented 2025 technique. Operando radiography of a lead-acid test cell
This result is useful partly because it includes a limitation. The experiment did not become unsuccessful merely because one desired quantity proved difficult to resolve. It established which observations were feasible in the tested arrangement and identified where further work was needed. That is practical knowledge for planning the next experiment.
Custom hardware is common in research because instruments impose constraints on size, geometry, access, and background. The interpretive question is how those changes affect the phenomenon under investigation. A test cell need not duplicate a product in every respect to reveal a mechanism, but the relevant similarities and differences should be stated.
An original analogy is a scale model of a ventilation system. It may preserve the relationship needed to study one flow feature while failing to reproduce another. Its usefulness depends on the question and the justified scaling, not on whether it looks exactly like the full-size system. Likewise, a more visible electrochemical test cell can be a strong scientific model without being a complete product surrogate.
The strongest reporting makes the bridge explicit. Which behavior was checked against a relevant reference? Which geometry or material changed for imaging? Which conclusion is expected to transfer, and why? Answering these questions gives a reader more confidence than repeatedly describing the setup as realistic without defining the comparison.
Composition asks more than a single intensity can answer
Young and colleagues' May 18, 2026 study investigated spectroscopic neutron imaging for electrolyte characterization, using wavelength-dependent transmission to distinguish selected electrolyte mixtures. The work evaluated sensitivity under specified conditions and discussed model limitations. It supports calibrated chemical discrimination in the studied system, not unrestricted identification of any unknown liquid or proof that every proposed degradation process was directly imaged. Spectroscopic neutron imaging of electrolytes
The difference between detecting liquid and identifying its composition is fundamental. If two mixtures produce the same response in one measurement, intensity alone cannot separate them. Additional spectral information can provide more constraints, but those constraints still depend on the candidate compositions, calibration, and uncertainty.
Imagine an invented library containing three known mixtures. A new measurement resembles the second mixture within the available precision. That comparison may support a choice among those three candidates. It does not establish that every possible fourth mixture would look different. The candidate set is part of the inference, even when the classification is presented as a simple label.
This is why calibration should resemble the intended question. A series of carefully prepared mixtures can reveal how the response changes across a relevant composition range. If the real specimen introduces additional components or a different geometry, the interpretation may require new evidence. A successful calibration is a foundation, not a permanent exemption from checking applicability.
The same principle governs detection limits. A threshold belongs to a method, specimen, configuration, and decision rule. Removing those conditions from the number can make a useful result appear universal. A responsible summary explains the achieved discrimination without converting it into a promise that every future electrolyte will be equally easy to distinguish.
The reference image deserves its own scrutiny
Many imaging analyses depend on a comparison with a reference. The reference may represent an empty path, a dry state, an initial state, or another defined condition. Those choices answer different questions. Calling all of them a baseline can conceal what has actually been subtracted or normalized.
An original numerical example begins with a measured value of eighty and a reference of one hundred. Their ratio is 0.8. If the appropriate reference were ninety instead, the ratio would be about 0.889. The measured value has not changed; the normalized result has. This elementary calculation explains why reference selection can matter even before a complicated model enters the analysis.
Now suppose the reference itself changes over time. A fixed initial reference may reveal a mixture of specimen evolution and instrument drift. Repeated reference measurements may help characterize the drift, but they also consume time and must be appropriate to the experiment. The design has to decide which changes it can distinguish.
A dry-state reference introduces another interpretive question. Does drying leave the structure sufficiently comparable to the operating state for the intended subtraction? The answer is material- and experiment-specific. The image-processing operation can be mathematically straightforward while the physical comparison remains demanding.
A reader need not reproduce the whole analysis to ask these questions. The methods should identify what each reference represents and how it was acquired. A figure that displays normalized intensity without that context leaves a crucial part of the measurement unspecified.
A regional average can hide opposite movements
Consider two equal regions in an invented device. Initially, each contains five arbitrary units of liquid. Later, one contains eight and the other contains two. The total remains ten. A whole-device average reports no change even though a substantial redistribution has occurred.
Now imagine that the wetter region is near a critical transport path while the drier region is elsewhere. The redistribution may matter operationally despite the unchanged total. A spatial measurement is valuable precisely because it can reveal patterns that a total conceals. But the analysis must preserve the relevant spatial distinctions rather than average them away immediately.
The opposite problem is also possible. A local change can look dramatic while involving only a small fraction of the device. Reporting the local maximum without its extent may exaggerate its contribution to overall behavior. A useful analysis connects local severity with spatial coverage and, where justified, with the relevant operational measurement.
This suggests a practical reporting sequence: show where the feature occurs, how extensive it is, how it evolves, and how those observations relate to the device's behavior. Each step adds information. Skipping directly from a bright spot to a global performance explanation makes the causal leap harder to evaluate.
The numerical examples here are intentionally simple because the reasoning should remain visible. Sophisticated processing does not remove the need to distinguish redistribution from accumulation or local intensity from total contribution. Those distinctions are often the reason an imaging experiment was needed in the first place.
Repetition tests the mechanism, not just the camera
A striking event observed once can motivate a hypothesis. Repeated observations help establish whether the event is reproducible under the relevant conditions. In operating devices, repetition may involve new specimens, repeated cycles, or repeated conditions within one specimen. These are not interchangeable forms of evidence.
Repeating a measurement on the same device can test short-term consistency while leaving device-to-device variation unknown. Examining several devices can address that variation but may introduce differences in preparation or history. A good study identifies what was repeated and which uncertainty the repetition addresses.
An original planning example distinguishes three possible failures. The image processing may be unstable, the physical event may be intermittent, or the device may vary from specimen to specimen. Reprocessing the same data helps investigate the first. Repeating operation in one device helps with the second. Preparing additional devices helps with the third. No single repetition strategy resolves all three.
This reasoning also clarifies why a polished video is not a substitute for a study design. A video can show an event convincingly while providing little information about how often it occurs. Its evidential role should match its selection: an illustrative event, a representative sequence supported by broader analysis, or part of a systematic comparison.
For engineering use, the frequency and conditions of a problem can matter as much as its visual mechanism. A rare failure under a particular stress may require a different response from a common limitation during normal operation. Imaging makes the mechanism visible; careful sampling establishes how that mechanism fits into the larger reliability question.
Use the image to choose a change, then test the change
The ultimate value of an operando image is often a better decision about design or operation. A researcher may identify a region that accumulates liquid, an uneven distribution of active material, or a recurring gas pocket. The image suggests a target. It does not, by itself, prove that the first proposed remedy will improve the device.
Suppose an invented flow redesign reduces the visible gas pocket but increases another loss elsewhere. The image-based objective has improved while the overall device has not. This is not a contradiction; it shows that the chosen feature was only one part of the system. A design evaluation should include the operational outcomes that motivated the intervention.
A stronger sequence is to state the mechanism, propose a change intended to affect it, predict the observable consequences, and then test both the spatial response and the relevant performance. If the spatial feature changes but performance does not, the result refines the causal model. If performance improves without the expected spatial change, the proposed explanation needs reconsideration.
This approach turns imaging from an illustration into an experimental discriminator. It encourages predictions that can fail. The goal is not to collect a visually satisfying before-and-after pair, but to learn whether the change acted through the mechanism that the researchers proposed.
The distinction is particularly important when moving toward larger devices. A successful small-cell intervention can encounter different transport distances, thermal conditions, or manufacturing constraints at another scale. The next experiment should examine the relevant transfer, rather than assuming that a promising local mechanism automatically settles the system-level design.
Decide what an inconclusive image will mean
A useful experiment plan includes the possibility that the target change will not be distinguishable. Without that preparation, a weak signal can invite an improvised explanation: perhaps the mechanism was absent, perhaps the detector missed it, or perhaps the conditions were wrong. Those possibilities cannot be separated merely by wishing the image were clearer.
An original decision exercise starts with two competing hypotheses. The first predicts a large spatial redistribution; the second predicts little redistribution. Before collecting data, the team estimates what size of change its analysis could distinguish under the planned conditions. If the measurement is sensitive enough to separate the predictions, an unchanged image can become informative. If both predictions fall below the distinguishable range, an unchanged image settles little.
This is the difference between evidence of no relevant change and an absence of usable evidence. The wording matters because an inconclusive result can otherwise become a strong claim in a summary. A careful report states the range of changes compatible with the measurement rather than converting every visually quiet sequence into proof of stability.
The same planning helps choose where to spend additional resources. If the competing predictions differ mainly in location, better spatial discrimination may matter. If they differ mainly in timing, faster acquisition may matter. If they differ in chemical state, a different contrast mechanism may be necessary. Increasing the total amount of data without identifying the unresolved distinction may leave the experiment equally inconclusive.
A predefined decision rule does not eliminate exploration. Researchers can still discover an unexpected event and investigate it. It simply keeps the original test distinguishable from the later interpretation. That distinction protects both: the planned comparison retains its meaning, and the unexpected observation can be presented honestly as a new lead rather than retroactively described as the expected outcome.
Preserve the quiet intervals too
A dramatic frame is easy to remember. The intervals before and after it can be equally important. They show whether the feature emerged gradually, followed a change in operation, persisted after that change, or returned to its earlier state. Selecting only the dramatic moment can remove the temporal context needed to evaluate a mechanism.
Imagine a hypothetical sequence with an electrical adjustment at minute five and a visible redistribution at minute seven. A single frame from minute seven shows the redistribution but not the delay. The delay may be relevant to a transport explanation. A longer sequence can reveal whether the response is consistent across repeated adjustments or whether the apparent association was accidental.
The appropriate archive therefore includes more than the images chosen for a figure. It preserves the operational timeline, excluded intervals and reasons for exclusion, processing choices, and links between measurements. These records allow another analyst to ask a different question without mistaking a curated presentation for the complete experiment.
This is especially useful when an initial hypothesis changes. A quiet interval may later become a control, or an apparently unimportant transient may reveal a synchronization problem. Keeping that context is not an instruction to interpret every fluctuation as meaningful. It is a way to retain the evidence needed to decide which fluctuations deserve attention.
What the invisible view adds
Neutron imaging earns its place when it reveals a difference that another measurement leaves unresolved: water in a particular compartment, gas displacing liquid, a magnetic reaction product, or a composition-dependent response. Its value is not that it supplies a universal interior photograph. Its value is that carefully selected interactions can expose a question hidden by the device's outer shell and aggregate readings.
The most persuasive studies make the interpretation as explicit as the picture. They identify the contrast mechanism, the reference, the timing, the specimen modifications, and the link to operation. Complementary measurements then reduce specific ambiguities rather than simply adding visual variety.
For a reader following new energy technology, this offers a useful alternative to judging progress solely by a headline efficiency or capacity. A study that explains where a limitation arises can make later improvement more rational, even when it does not itself announce a better commercial product. Understanding a failure mechanism is a substantive result.
The machine remains a system, not a collection of colored pixels. Water, gas, material state, geometry, and electrical behavior interact. A good neutron experiment does not pretend to collapse all of them into one answer. It gives researchers a better way to ask the next question while the machine is still working.