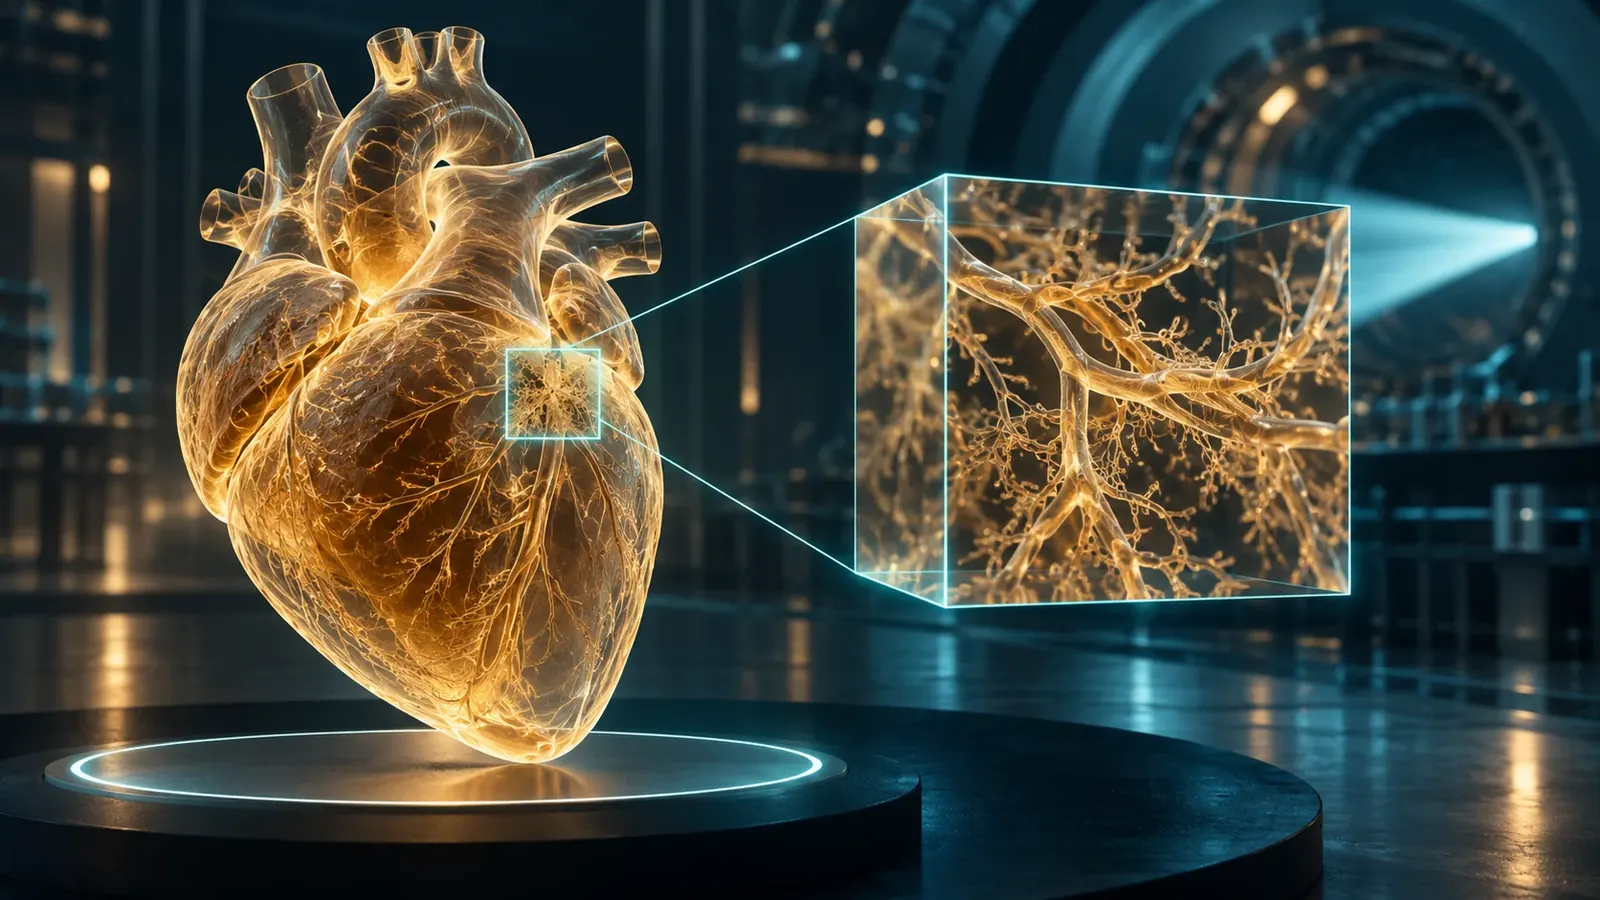
Synchrotron imaging can connect an organ's architecture with selected microscopic regions. The difficult part is preserving the meaning of that journey across scales.
An image of a whole human organ invites an ambitious gesture: zoom in. Follow a vessel through a chamber, approach its wall, and keep going until the landscape becomes a neighborhood of cells. On a screen, that movement can feel effortless. In an experiment, each change of scale spends something. It may spend acquisition time, field of view, storage, specimen stability, or confidence that a selected detail represents the larger object.
The Human Organ Atlas paper, published online on March 11, 2026, describes an open resource built around hierarchical phase-contrast tomography of donated human organs. Whole-organ imaging and finer regional acquisitions occupy different levels of the resource. The publication combines access to multiscale volumes with tools and guidance for their use. It concerns specimens outside the body, not a new scanner that can examine a living patient at cellular resolution. Human Organ Atlas
That distinction opens a more interesting story than a simple race toward smaller pixels. Synchrotron imaging gives researchers ways to connect a large anatomical context with details that conventional sectioning can separate from that context. Yet a reconstructed volume is also a chain of decisions about illumination, preparation, geometry, computation, and selection. The better the images become, the more important those decisions become to their interpretation.
This article follows that chain. It uses primary research and originating facility documentation, alongside explicitly invented arithmetic examples, to explain what a whole-organ picture can support and what an attractive zoom cannot establish. It does not offer a medical diagnosis, an operating procedure, or a claim that all organs in a repository were measured at their finest displayed scale.
A projection folds depth into a flat measurement
Imagine a transparent box containing several overlapping shapes. Viewed from one side, two shapes may occupy the same position in the picture even though they sit far apart in depth. Turn the box and their apparent overlap changes. This is an intuitive starting point for tomography: different viewing directions constrain how an object can be arranged in three dimensions.
The analogy has an important limitation. An X-ray projection is a measurement of the interaction between radiation and the object along the measurement path, not an ordinary photograph of transparent shapes. A reconstruction must relate those measurements to an explicit physical and mathematical model. Rotation supplies additional constraints; it does not automatically supply the correct model or make an unstable specimen stationary.
The ESRF's own ID19 techniques account distinguishes absorption contrast from phase-sensitive approaches, including propagation-based imaging. Absorption changes transmitted intensity, while phase effects can become visible after propagation. The facility description also separates radiography from tomography. It is a useful originating explanation of available methods, rather than evidence that one configuration is universally best for every specimen. ID19 imaging techniques
For a reader, the key question is what the recorded brightness means. If an article presents a bright boundary, does brightness represent greater attenuation, a phase-related edge feature, a processed quantity, or a color assigned during visualization? The same visual language can represent different physical quantities. A scale bar establishes distance, but it does not answer this question about contrast.
A practical way to read an unfamiliar image is to translate its caption into a sentence with a verb. The detector recorded transmitted intensity. The reconstruction estimated a volume. The display assigned colors to selected values. Those are three different actions. Keeping them separate prevents a useful representation from turning silently into a direct photograph of every property that a reader associates with its colors.
Why the edge can be easier to see than the interior
Consider an invented drawing with two adjacent gray regions. If their gray values differ only slightly, the boundary is difficult to locate. Now imagine that the drawing adds a light line on one side of the boundary and a dark line on the other. The boundary becomes obvious even if the interiors remain similar. This illustration explains why boundary-sensitive contrast can be valuable, but it also explains why interpreting every bright line as a material layer would be a mistake.
A phase-sensitive image has a physical origin, not an illustrator's outline. Nonetheless, the reading problem is comparable: the feature that makes an interface visible may not map directly onto a separate piece of tissue. A reconstruction method must account for how the contrast was formed. Merely enlarging the image does not resolve that interpretive problem.
In a foundational 2002 paper, Paganin and colleagues described retrieving phase and amplitude from a single defocused image under a homogeneous-object assumption. The accessible primary summary supports that conditional formulation; it does not justify treating the method as assumption-free or reproducing its full derivation here. Simultaneous phase and amplitude extraction
The broader lesson is a general one about inverse problems. A simplifying assumption can turn an otherwise difficult reconstruction into a useful, tractable calculation. Its value depends on whether departures from that assumption matter for the question being asked. A model that is adequate for identifying the gross outline of a structure may be inadequate for assigning a small quantitative difference to a specific material property.
Suppose two analysts obtain nearly identical organ outlines but different thickness estimates for a narrow boundary. That disagreement does not necessarily invalidate the organ outline. It indicates that the narrower measurement requires a separate justification. Evaluating the model at the scale of the actual claim is more informative than declaring an entire image either true or false.
The hierarchy was designed, not discovered by scrolling
Walsh and colleagues' 2021 study demonstrated hierarchical phase-contrast tomography across intact human organs, combining larger-volume acquisitions with selected higher-resolution regions. The method's value lay in connecting scales without first dividing the organ into the many physical sections needed for conventional microscopy. Its finest regional sampling did not mean that every point in every organ had been acquired at that finest setting. Imaging intact human organs with hierarchical phase-contrast tomography
A digital viewer can conceal this distinction because it offers one continuous gesture. The user turns a wheel or pinches a screen. Underneath, the viewer may move between levels, load a separate acquisition, interpolate a display, or enter a region with additional measured detail. Those operations can look similar while carrying different evidential meanings.
An invented atlas can make the issue concrete. Imagine a whole object measured on a coarse grid and three selected regions measured on a finer grid. A reader who enters one of those regions gains additional information. A reader who zooms equally far into a fourth region may only enlarge the coarse samples. Equal magnification on the screen does not imply equal measurement underneath.
The interface should therefore communicate acquisition coverage, not merely zoom level. A boundary or legend can show where higher-resolution evidence exists. An export should preserve the acquisition identifier and physical sampling interval. A screenshot stripped of these details may remain beautiful, but it becomes harder for another researcher to determine what was actually observed.
The hierarchy also records scientific choices. Someone selected those three regions. Perhaps they were chosen systematically, perhaps because a coarse scan revealed an unusual structure, or perhaps because they were accessible and stable. Each approach can be legitimate for a different purpose. The important issue is whether a later argument remembers the selection process when moving from a close-up to a whole-organ conclusion.
The arithmetic of wanting everything at once

Original hypothetical storage arithmetic for a fixed cubic field at two bytes per voxel. Not measured atlas performance.
Here is an original storage exercise, not a specification for any cited atlas. A cubic field sampled with one thousand positions along each edge contains one billion voxels. At two bytes per voxel, the reconstructed values alone occupy two billion bytes, or two decimal gigabytes. That total excludes projections, intermediate files, labels, backups, and metadata.
Now halve the voxel spacing while keeping the same physical field. Each edge needs twice as many samples. The volume therefore contains two times two times two, or eight times as many voxels. The two-gigabyte array becomes sixteen gigabytes. Halve the spacing again and it becomes one hundred twenty-eight gigabytes. The display may still show a cube of the same size.
This simple cubic scaling explains why regional imaging can be a thoughtful experimental design rather than an embarrassing compromise. If only one eighth of the physical volume requires the finer sampling, concentrating the extra acquisition there can change the resource demand substantially. The correct strategy depends on the biological question and the risk of overlooking important regions, not on a universal preference for either complete coverage or maximum detail.
The calculation also distinguishes storage from knowledge. Eight times as many samples do not guarantee eight times as much useful information. Some may record redundant structure, blur, noise, or empty background. Conversely, one small region may answer a focused question that a much larger low-detail survey cannot. Counting bytes is a planning tool, not a scientific value system.
A proposal that asks for finer sampling should therefore say what decision will change. Will it distinguish two competing anatomical interpretations? Will it allow a boundary to be measured rather than merely located? Will it support an independent comparison? A clear answer makes the additional resource demand intelligible. A vague promise of more impressive pictures does not.
A small pixel is an address, not a guarantee
A voxel size describes the spacing or extent of elements in a reconstructed grid. It is not, by itself, proof that two structures separated by that distance can be distinguished. A useful analogy is a spreadsheet containing an estimate to six decimal places. The number of displayed digits says something about representation, but the uncertainty may be much larger than the final digit.
Weitkamp and colleagues' ANATOMIX instrumentation account describes a beamline with distinct imaging modes, optics, and sampling ranges. The version examined here was posted in 2022, following an earlier 2020 submission, and is associated with a 2022 conference publication. Its broad pixel-size range reflects different configurations; it should not be repackaged as one resolution delivered across any specimen size. ANATOMIX beamline instrumentation
For an invented example, consider a narrow object whose image is spread across several neighboring samples. Making the grid finer can represent that spread more smoothly without recovering the object's original width. A reader may see a cleaner outline while the measurement still depends on the same blur. Sampling and resolving are related, but they are not interchangeable verbs.
This distinction becomes especially important when comparing images from different sources. One team may report voxel spacing, another may report an experimentally assessed resolution, and another may show a visually selected feature. Ranking those numbers as though they measured the same quantity creates a competition that the experiments never actually ran.
A fair comparison begins with a matched question: which feature, in which specimen, under which acquisition and reconstruction conditions, was distinguishable by which criterion? Sometimes the available publications do not permit that comparison. Saying so is more useful than manufacturing a league table from incompatible numbers. The absence of a simple ranking is not evidence that the instruments lack value.
The organ has a history before it reaches the beam
A donated organ is not a frozen copy of its living state in the everyday sense of that phrase. It has undergone collection, preservation, handling, and preparation. Those events can affect the geometry and appearance that the instrument later records. The question is not whether preparation occurred, but which conclusions remain justified after accounting for it.
The Human Organ Atlas authors explicitly discuss preparation-related limitations, including shrinkage and collapsed vessels or chambers. Their resource therefore offers extraordinary access to preserved anatomy without claiming that every measured dimension reproduces a living, pressurized organ. This limitation belongs beside the images, not in a distant footnote consulted only after a discrepancy appears. Atlas discussion and limitations
Imagine a researcher measuring the diameter of a channel in a preserved specimen. The image may support a precise measurement of that specimen in that state. Inferring the diameter during life requires further information about preparation, pressure, deformation, and the intended comparison. Precision within the image does not eliminate the difference between these two questions.
The distinction can be expressed without diminishing the research. A preserved object can retain valuable spatial relationships even when some dimensions change. A map of branching or adjacency may remain informative for a purpose that does not require an exact living diameter. The relevant assessment is claim-specific: which properties are robust enough for this inference, and which require additional validation?
An honest atlas makes specimen history searchable alongside anatomical detail. Otherwise, a future user may compare two volumes without realizing that their preparation histories differ. The difference could then be mistaken for a biological contrast. Metadata is not decorative administration in this situation. It is part of the information needed to choose a scientifically meaningful comparison.
Two hearts do not establish a diagnostic test
Brunet and colleagues' 2024 study used hierarchical phase-contrast tomography to examine two human hearts outside the body, including normal and diseased examples. Its primary abstract and figure captions describe whole-heart imaging with finer regional investigations. This is evidence of a multiscale anatomical demonstration, not a population study establishing diagnostic sensitivity, disease prevalence, or patient outcomes. Multiscale imaging of the human heart
The distinction matters because visual demonstration and diagnostic validation ask different questions. A demonstration asks whether a method can reveal or characterize a feature in selected material. A diagnostic study must also establish how reliably a decision works across relevant people, conditions, alternatives, and errors. The first can motivate the second without substituting for it.
Consider an invented set of two specimens: one known to have a feature, one known not to have it. An imaging method that displays a difference has passed an interesting first test. It has not shown how often unrelated features create a similar appearance, how frequently the target feature is missed, or whether the result generalizes to less clear examples. Those uncertainties remain even if the displayed images are exceptionally sharp.
This is a useful discipline for science reporting. Describe what the experiment actually compared before describing what the technology might someday enable. Readers can then appreciate the result without being asked to believe that every plausible application has already been validated. A narrow, accurate account often makes the advance more understandable than an inflated clinical promise.
It also helps researchers decide what comes next. If the present evidence establishes visibility, the next experiment might test repeatability or comparison against another method. If it establishes a quantitative measurement in a small set, the next question may concern variability across specimens. Progress becomes a sequence of answerable questions rather than a leap from a striking image to a promised medical revolution.
A phantom is a controlled challenge, not a patient
Ahlers and colleagues investigated propagation-based imaging using an anthropomorphic chest phantom, comparing detector approaches and acquisition conditions. Their 2025 primary manuscript supports conclusions about that experimental object and configuration. It does not establish the same performance in living patients or make its preferred settings a general clinical recommendation. Propagation-based chest imaging with a phantom
The advantage of a controlled object is that researchers can vary parts of the measurement while holding much else steady. This helps isolate effects that would be difficult to separate in a more variable setting. The limitation is equally clear: the object does not reproduce every relevant property of the intended application. A good experiment uses that simplification deliberately.
Suppose an invented imaging comparison changes both the detector and the exposure while leaving all other conditions fixed. A visible improvement may reflect the detector, the exposure, or their interaction. A more carefully designed comparison would make those alternatives explicit. The point is not to demand an impossibly pure experiment, but to identify what a comparison can actually isolate.
A phantom result can be especially useful for rejecting weak configurations before more demanding work. It can also expose trade-offs that a showcase image conceals. Perhaps one setting makes large boundaries clearer while another preserves small features better. Choosing between them requires knowing the intended task, rather than assuming that one image must be globally superior.
For the public, the word phantom should be explained instead of buried. It signals that the investigators used a physical test object rather than a person. That fact changes how one interprets realism, variability, movement, and eventual clinical translation. It does not reduce the experiment to make-believe; it identifies the controlled stage of evidence that the experiment occupies.
When observation changes the thing being observed
Synchrotron research also has to confront the possibility that illumination changes a specimen. An especially clear caution comes from a different measurement mode. Jousseaume and colleagues' 2023 battery study used operando X-ray diffraction and reported beam-related changes influenced by both dose and dose rate, including artificial phase transitions. This is not a tomography demonstration or a biological dose threshold; it illustrates why apparent behavior during irradiation needs appropriate controls. Beam damage in operando battery studies
The general experimental question is whether a changing image records the intended process, the measurement's influence, or both. That question cannot be answered by pointing out that the instrument is noncontact. A measurement can interact with a specimen without touching it mechanically. Nor does the absence of visible gross damage establish that every property of interest remained unchanged.
An original thought experiment shows the difficulty. Imagine a specimen scanned repeatedly while a researcher expects a slow transformation. The feature of interest changes steadily across scans. The trend is compatible with the intended transformation, but it is also compatible with cumulative exposure or a combination of influences. The time sequence alone does not identify the cause.
The appropriate controls depend on the material and question. Conceptually, one wants comparisons that separate elapsed time, treatment history, and measurement exposure. This is a reasoning framework, not a prescribed exposure protocol. It explains why a publication's control design can matter more than the smoothness of its time-lapse visualization.
The same care should govern language. A static reconstruction can be described as a view of a specimen under specified conditions. A dynamic interpretation adds a causal claim about how that specimen changed. Each additional causal claim requires evidence beyond the mere existence of a sequence of images. The more persuasive the animation, the more worthwhile it is to ask which alternatives were tested.
A whole mouse brain still needs a map
Humbel and colleagues presented an extended-field tomography dataset of a postmortem mouse brain, with 0.65-micrometer voxels and approximately 3.3 trillion voxels in the reconstructed field. Their manuscript also describes registration to an established anatomical coordinate framework and hierarchical storage for browser-based exploration. The full text clarifies the included anatomy and processing; the phrase whole brain should not be read as a functional connectome or a record of neural activity. Mouse-brain tomography and atlas integration
This work points toward a practical issue that can disappear behind acquisition records. A very large volume is useful only if people can find, compare, and cite regions within it. Someone studying a particular structure needs a way to reach that structure without first becoming an expert in every storage and reconstruction decision.
Registration is a correspondence problem. It relates positions in one representation to positions in another. In an invented classroom example, two maps of the same neighborhood may differ in scale and orientation. Aligning a few recognizable landmarks helps the reader move between them. Biological specimens can require more complex transformations, but the basic question remains: which location in one representation corresponds to which location in the other?
A correspondence is not a declaration that two specimens are anatomically identical. If a transformation makes structures overlap, the transformed view can help navigation while also concealing some original geometric differences. Researchers should retain access to the source coordinates and transformation information when those differences matter to the analysis.
This is why an attractive atlas interface should offer more than a search box. It should help users distinguish observed features, inherited anatomical labels, and algorithmically transferred annotations. Those layers can cooperate without being treated as interchangeable evidence. The label helps locate a candidate region; the underlying image and appropriate validation support claims about what is actually present there.
The screenshot is the least reusable part
A screenshot is excellent for communicating an observation quickly. It is poor at preserving the full path back to that observation. Cropping can remove context, a color map can obscure intensity relationships, and a rotated view can make a location difficult to recover. None of these choices is automatically wrong, but each should be reversible or documented when the image supports a substantive claim.
Imagine two colleagues discussing a small branching feature. One sends a cropped picture with an arrow. The other sees the feature but cannot determine its orientation, location, or relation to nearby structures. A second message containing the dataset identifier, coordinates, view direction, and display settings turns the discussion from a visual impression into something another person can inspect.
That extra information also protects against accidental overstatement. If the second researcher discovers that the feature lies near the boundary of a high-resolution region, the boundary becomes relevant to interpretation. If the apparent branch disappears under a different display range, the group has a concrete question to investigate. Reproducibility begins with the ability to return to the same place.
A public-facing article need not display every technical setting in its main text. It should, however, provide a reliable route to them. A figure can carry a concise caption while its associated record preserves the fuller context. The aim is layered communication: easy entry for a new reader, recoverable detail for a serious user.
For long-lived resources, this also means separating stable identifiers from temporary interface behavior. A browser may change its layout, a server may reorganize files, or a rendering tool may adopt a new default. The scientific location should remain identifiable despite those changes. Otherwise, an image that once supported a clear claim can become an attractive dead end.
Selection can hide inside a beautiful tour
A guided sequence through a volume can create the impression of comprehensive examination. The viewer sees several remarkable regions and feels that the organ has been thoroughly explored. But a tour is still a selection. Its stops reflect the author's interests and the available acquisitions, not necessarily a systematic sample of everything the organ contains.
An original hypothetical makes the distinction concrete. A team examines one hundred candidate regions and displays the five most visually distinctive ones. Those five may be genuine and scientifically interesting. They cannot, by themselves, establish that their appearance is typical of the other ninety-five. The missing denominator changes the meaning of the presentation.
There are several legitimate ways to respond. The researchers can frame the images as illustrative examples, describe the selection criteria, or analyze a defined set of regions systematically. The choice depends on the claim. Discovery-oriented exploration does not need to pretend that it began as a blinded population study, but later quantitative conclusions should acknowledge how the candidates were found.
This distinction is particularly important when a viewer makes exploration easy. Interactive access can generate new hypotheses far beyond the original experiment. That is a strength of an open resource. It also means that later users inherit responsibility for their own sampling and comparison choices; the existence of a high-quality atlas does not automatically validate every analysis performed with it.
A responsible tour therefore leaves the reader with two things: a reason to care about the displayed structure and a sense of how it was selected. The first supplies interest. The second supplies interpretive scale. Together they allow beauty to invite investigation without quietly standing in for statistical evidence.
Annotation is a measurement decision too
Once a reconstructed volume exists, researchers may identify boundaries, label structures, and calculate volumes or lengths. These steps can appear to be bookkeeping after the real experiment. In practice, they determine which image features become quantities. A small change in a boundary rule can change a measurement even when the underlying voxels remain untouched.
Consider an invented circular cross-section with an uncertain edge. If the assigned radius changes from ten units to eleven, the calculated area changes from one hundred times pi to one hundred twenty-one times pi. That is a twenty-one percent increase from a ten percent radius change. This elementary example is not a model of a specific organ; it shows why boundary uncertainty deserves attention in derived quantities.
For a three-dimensional sphere, the same hypothetical radius change produces a volume factor of 1.1 cubed, or approximately 1.331. The volume increases by about thirty-three percent. Real anatomy is rarely spherical, but the exercise makes a general point: geometric calculations can amplify seemingly modest decisions about where a structure begins and ends.
An annotation workflow should therefore preserve enough information to examine those decisions. It may record the rule, the software version, the annotator's role, and how ambiguous cases were handled. For a particular study, repeat annotation or an independent comparison may help assess sensitivity. The appropriate design depends on the importance of the quantity and the available evidence.
This is not an argument against automation. It is an argument for making automated and manual decisions inspectable. A human outline can be inconsistent; an algorithm can be consistently wrong in a particular region. The useful question is how either method's errors affect the conclusion, rather than whether a person or a machine drew the boundary.
What a sensible next experiment would ask
Suppose an atlas reveals a previously overlooked spatial relationship. The most productive next step is unlikely to be simply acquiring the same image at a more dramatic magnification. A stronger plan begins by naming the competing explanations and deciding which additional observation would separate them.
If the concern is preparation-related deformation, the comparison should address preparation history. If the concern is regional selection, it should address sampling. If the concern is whether a visible boundary corresponds to a particular tissue feature, a complementary validation may be needed. If the concern is a reconstruction assumption, the analysis should examine sensitivity to that assumption. These are different uncertainties and require different evidence.
An original planning exercise can assign a limited budget to three candidate activities: another fine regional scan, an independent annotation of existing data, or better specimen-history documentation. There is no universal winner. The best choice is the one most likely to change the conclusion that matters. More data are valuable when they reduce the relevant uncertainty, not merely when they increase the file count.
This way of thinking also helps explain why shared resources deserve sustained support after their initial launch. Curation, documentation, and usable access can allow many later studies to extract more value from an existing acquisition. The return is not limited to a new image appearing on the day a beamline experiment ends.
At the same time, reuse should remain attached to the original specimen and acquisition context. A dataset does not become context-free because it is downloadable. Good secondary research can pose new questions while respecting the limits of the material that was originally collected.
The cost of moving the window
The same digital object can be useful to an expert at a research institution and effectively inaccessible to someone with a modest connection. An open download link does not, on its own, solve that difference. File size, documentation, software requirements, and navigation all affect whether another person can work with the evidence.
Return to the invented two-gigabyte volume from the storage exercise. At a sustained transfer rate of ten megabytes per second, the ideal transfer time is two hundred seconds. At one megabyte per second, it is two thousand seconds, or a little over thirty-three minutes. These arithmetic estimates ignore connection overhead and interruptions. They are not measurements of an atlas service; they illustrate why access can feel very different to two users of the same resource.
Now consider the sixteen-gigabyte version. Under the same simplified assumptions, it takes eight times as long. Requiring every user to obtain the whole volume before inspecting a small region can therefore impose a substantial entry cost. A system that delivers a useful overview first and more detail as needed changes the practical experience, even though the underlying scientific content has not become smaller.
The trade-off is that convenience can conceal which information has actually arrived. A viewer should help distinguish a coarse preview from a fully loaded region. An analyst exporting data should know the physical scale and coverage of that export. Otherwise, someone may perform a calculation on a convenient preview while believing that it contains the finest available measurements.
Accessibility also includes conceptual navigation. A new user may recognize an anatomical term but not know how the dataset represents it. An experienced imaging researcher may understand acquisition parameters while lacking the biological context needed to interpret a region. Good documentation provides more than one path through the material rather than assuming that every reader starts with the same expertise.
For educational reuse, a compact, well-documented subset can sometimes be more valuable than a complete but bewildering archive. It lets a student practice locating a feature, recording coordinates, changing display settings, and explaining uncertainty. The subset should remain linked to its parent volume so that convenience does not erase provenance or create the impression that the selected examples represent everything.
Separate uncertainty in position from uncertainty in meaning
Two researchers can agree about the location of a visible feature and disagree about what it represents. They can also agree about its identity while disagreeing about its exact boundary. These are different kinds of uncertainty, and a single confidence label may obscure the distinction.
An invented annotation exercise can make this explicit. Give each candidate feature two fields: one for positional certainty and one for interpretive certainty. A sharply bounded structure with an uncertain identity receives a different description from a confidently identified structure with an indistinct edge. Neither should be reduced automatically to a single score that hides why the uncertainty exists.
This distinction matters when choosing a follow-up. Better spatial sampling might help locate an edge without resolving the biological identity. A complementary identification method might establish identity without improving the original geometric measurement. The uncertainty description should guide the next step rather than merely decorate the final figure.
It also improves public explanation. Instead of saying that an image is uncertain in a vague way, an author can say precisely what is established and what remains open. The structure is visible in this region; its exact boundary depends on the annotation rule. Or the boundary is repeatable; the biological interpretation requires another form of evidence. Such sentences preserve the achievement while identifying the unfinished question.
That is a more demanding kind of clarity than adding a cautionary paragraph at the end. It asks the writer to keep each claim attached to the part of the measurement that supports it. In return, readers gain a practical understanding of how an impressive image becomes a reliable scientific argument.
The most important zoom is conceptual
The promise of synchrotron organ imaging is not merely that readers can see smaller things. It is that structures can be examined within a larger spatial setting, with selected paths between scales. That ability can change which anatomical questions are practical to ask. It also makes the difference between coverage, sampling, reconstruction, and interpretation impossible to ignore.
A convincing account should let a reader move in both directions. From the whole organ toward a region, it should explain where additional evidence enters. From a striking detail back toward the whole organ, it should explain what permits the inference to travel. If either path is missing, a smooth visual experience can conceal a discontinuity in the reasoning.
For any interactive research volume, a useful reading habit is to move from the displayed feature back to its acquisition context before advancing an interpretation. Ask what was measured here, what was selected, and which comparison would change the conclusion.
The whole organ and the tiny window belong together. The organ supplies context; the window supplies detail. Scientific judgment lies in knowing what each contributes, where their connection has been measured, and where another experiment is still needed.