
Hours at temperature and repeated changes in operating state age a fuel-cell stack in different ways. Understanding both is essential to judging its efficiency, flexibility and useful life.
A solid oxide fuel cell has a life measured in hours, but hours alone do not describe its experience. A stack held at a stable operating point for a long period has lived through a different experiment from one repeatedly heated, cooled, loaded, unloaded or exposed to changing fuel conditions. Two systems with the same operating-hour counter may have accumulated different kinds of damage.
The distinction becomes visible at a scale far smaller than the stack. In a preprint revised on April 8, 2025, Sabrina Weber and colleagues compared three-dimensional anode structures associated with different manufacturing methods, annealing histories and temperatures. Their analysis used reconstructed nickel, ceramic and pore regions and examined geometric descriptors locally as well as across the imaged volume. Annealing and image analysis are not interchangeable with a complete operating-stack lifetime test, but the work shows why an electrode's internal arrangement deserves attention alongside its initial electrical performance. Three-dimensional anode morphology study, version 2.
The two clocks are a useful way to organize the engineering problem. One tracks sustained exposure: time at temperature, time under current and time in a particular chemical environment. The other tracks transitions: thermal cycles, fuel interruptions, changes in oxidation state and shifts in load. A successful design has to manage both, while the surrounding system turns the stack's direct-current output into useful electricity and handles its heat.
This is why a peak power-density result, an electrical-efficiency claim and a long-duration test answer different questions. They can all be impressive without describing the same device under the same conditions. The task is to connect them without creating an imaginary system that inherits the best result from every experiment.
The following analysis concerns the conventional oxide-ion-conducting SOFC architecture unless stated otherwise. Numerical examples are original simplified calculations, not predictions for a named commercial product. Their purpose is to make the engineering tradeoffs legible: where voltage is lost, where heat must move, why local fuel conditions matter and why a small degradation rate can become significant over a long operating life.
A ceramic separator sets the terms
The defining component is a solid ceramic electrolyte between two electrodes. In the oxide-ion version, oxygen is reduced on the air side, oxygen ions cross the electrolyte and fuel is oxidized on the fuel side. Electrons travel through an external circuit. The electrolyte must support the intended ionic transport while preventing the two gas streams from simply mixing through it.
The Department of Energy's technical overview identifies the high-temperature tradeoff clearly: ceramic-electrolyte fuel cells can use internal reforming and avoid some catalyst requirements associated with lower-temperature technologies, but startup and material durability become demanding. Its broad overview is not used here to assign a universal efficiency or temperature to every SOFC design. DOE's fuel-cell types overview.
For hydrogen, the net reaction combines hydrogen and oxygen to form water while delivering electrical work and heat. The charge balance is useful. Each mole of hydrogen oxidized corresponds to two moles of electrons. In an ideal accounting model, the molar consumption rate associated with current I is I divided by twice the Faraday constant. This relationship links an electrical measurement to a chemical consumption rate; it does not establish that every molecule entering the system is electrochemically used.
As a deliberately rounded example, a current of 193 amperes corresponds to about one thousandth of a mole of hydrogen per second when the Faraday constant is taken as approximately 96,500 coulombs per mole of electrons. The actual inlet flow would need to account for utilization, composition and system design. The example is not a fuel-setting instruction.
A stack adds another layer of arithmetic. Electrically connecting cells in series adds their voltages, while the same current passes through the series path. If one hundred hypothetical cells each operate at 0.75 volts and 100 amperes, their combined direct-current power is 7.5 kilowatts. That number excludes power conversion and auxiliaries. It also assumes every cell can sustain the stated current under its local conditions.
The last assumption is important. An average cell voltage can conceal a weak region or a poorly supplied cell. A series assembly does not give every cell an independent choice of current. The system's useful operating envelope is therefore constrained by distributions of conditions, not only by the average performance of a representative laboratory specimen.
The electrode needs three kinds of continuity
An electrode is a transport network as well as a reactive material. Gas must reach useful locations, electrons must have a conducting path and ions must connect to the electrolyte or an ion-conducting phase. A large amount of the right material is insufficient if the required pathways do not meet in a useful way.
Pawłowski and colleagues' 2022 preprint, later associated with an Energy and AI publication, used electron tomography and topological analysis to examine anode microstructure before and after extended operation. The approach investigated features beyond simple averaged phase fractions. Its relevance is that connectivity can change even when a bulk compositional description changes little. Microstructure evolution characterized by persistent homology.
An original network analogy helps explain the engineering consequence. Imagine a porous structure containing the same total volume of conducting material in two arrangements. In the first, it forms a continuous path across the region. In the second, it is divided into isolated islands. The amount of material is identical, but its ability to carry current across the region is not.
Pore space has a similar distinction. A large void that does not connect to the gas supply may contribute to measured porosity without providing the intended transport route. A narrow constriction can limit access to a much larger region behind it. That is why a single porosity number cannot fully specify how an electrode will behave.
The geometry also has competing objectives. Making features finer can increase interfacial area, yet it may create structures that evolve more rapidly or restrict transport in other ways. Making pores larger can improve access while reducing the amount of solid material available for conduction and reaction. There is no general rule that maximizing one geometric descriptor maximizes useful cell performance.
The measurement scale matters. A high-resolution image covers a limited volume. If that volume is not representative of the whole electrode, a precise reconstruction can still support an overgeneralized conclusion. Local descriptors are valuable because they expose heterogeneity, but the sampling plan determines how confidently those local observations can be extended.
This gives the first clock a physical meaning. Time at operating conditions can alter the geometry that originally made the electrode effective. The relevant question is not merely whether the cell still contains nickel, ceramic and pores. It is whether the pathways and interfaces still support the same transport and reaction demands.
Voltage loss is a symptom with several possible causes
A declining cell voltage at fixed current is a useful warning, but it is not a diagnosis. The observed change can combine losses associated with charge transfer, ionic and electronic resistance, contact behavior and gas transport. A terminal measurement compresses that collection of processes into a single number.
The simplest original bookkeeping relation writes operating voltage as a reversible reference voltage minus several losses. This is a way to organize the problem, not a uniquely identifiable decomposition from one measurement. If the total loss grows by twenty millivolts, the equation does not reveal which term changed.
A diagnostic experiment must therefore perturb or observe the system in ways that distinguish candidate causes. Electrochemical impedance spectroscopy is one such approach, but its interpretation still depends on models and operating conditions. A fitted equivalent circuit is not a literal photograph of the electrode. Different physical processes can contribute over overlapping frequency ranges, and a visually good fit does not guarantee a unique explanation.
Fang, Menzler and Blum's 2021 study combined long-term stack operation, impedance measurements and post-operation examination to investigate chromium-related degradation in two cathode materials and stack designs. The authors explicitly treated comparisons with care because the operating conditions and designs were not identical. This is stronger evidence than assigning every voltage decline to one contaminant solely because that contaminant is theoretically possible. Long-term stack degradation and chromium poisoning.
The general diagnostic strategy is to combine evidence with different sensitivities. An electrical signature can locate a change in behavior. Chemical analysis can identify material that accumulated. Microscopy can show where it accumulated and whether the structure changed. None of those observations alone necessarily proves the complete causal sequence.
A fictional example illustrates the danger of a single metric. Suppose a stack's voltage decreases while its measured temperature also falls slightly. Part of the voltage change may be associated with the changed operating condition rather than irreversible aging. Correcting for temperature requires a justified relationship, not an arbitrary adjustment designed to flatten the degradation curve. The uncorrected measurements and the correction method should both remain available.
An engineering diagnosis becomes persuasive when it explains several observations and predicts something testable about another condition. It becomes weak when every new symptom can be absorbed by changing a fitted parameter without any independent check.
The second clock includes chemistry, not just temperature
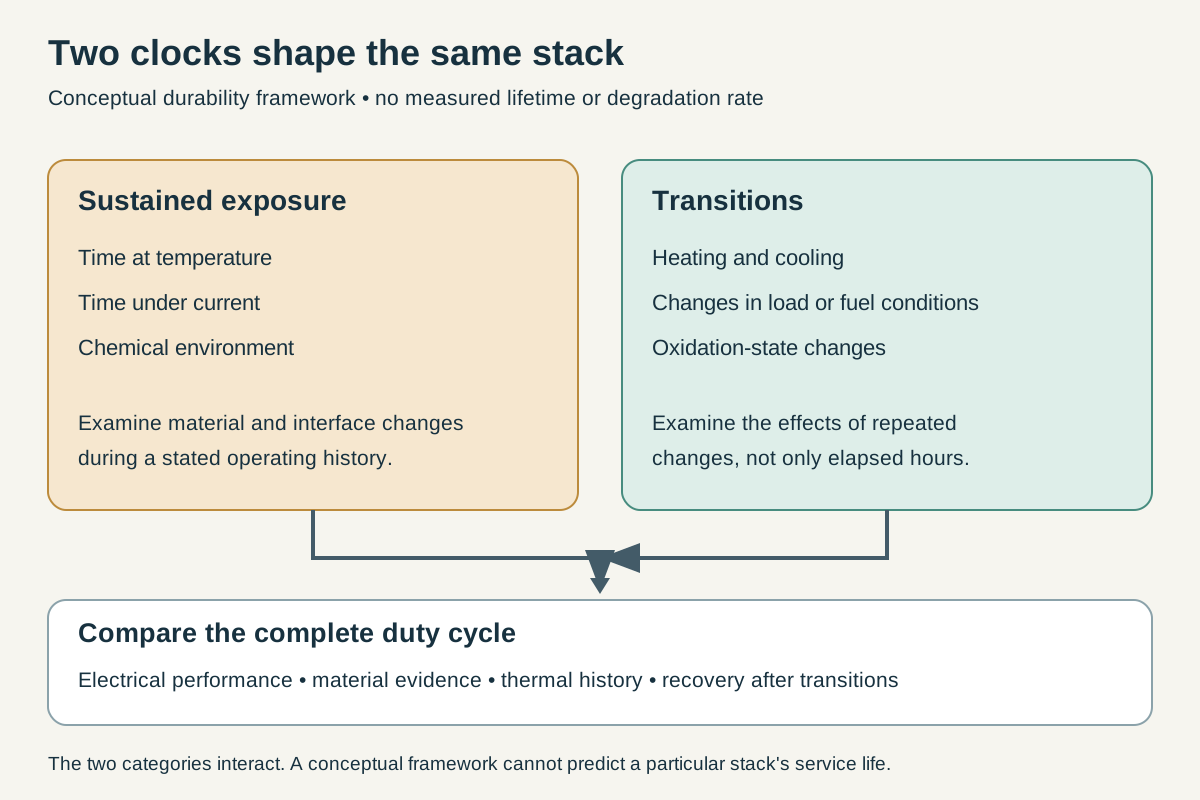
Conceptual durability framework, not a lifetime prediction. Sustained operating exposure and transitions can produce interacting changes; comparisons require a stated duty cycle.
Thermal cycling and redox cycling are related operational concerns, but they are not the same event. A thermal cycle changes temperature. A redox cycle changes oxidation state. A system can experience one without an identical amount of the other, and the resulting damage mechanisms need separate examination.
Ishibashi and colleagues' August 2020 study investigated alternative nickel-alloy anodes under reduction and oxidation cycling. Their experiments connected changes in durability to the preservation of conducting pathways and protective surface behavior in the tested materials. The study also described a performance tradeoff rather than a cost-free improvement in every property. Improved redox cycling durability in alternative anodes.
For interpreting a lifetime claim, the key question is what the test actually cycled. Ten thousand electrical load changes at nearly constant temperature are not ten thousand cold starts. A repeated excursion between two elevated temperatures is not the same as cooling fully to ambient. A laboratory redox exposure is not automatically representative of the chemical conditions reached during a particular system shutdown.
The amplitude, rate, dwell time and surrounding atmosphere all belong in the test description. So does the condition of the specimen before cycling began. A freshly manufactured cell and an already aged cell may not respond identically to the same imposed transition. Reporting only the number of cycles discards much of the experiment.
An original analogy is a fatigue test in which the count is known but the load range is not. One hundred large excursions and one hundred small excursions are numerically equal counts and physically different histories. The same reasoning applies to a thermal system: a cycle counter needs a definition of the event being counted.
The distinction affects system architecture. A battery or another fast-response component may be used to absorb short electrical fluctuations while a thermal conversion unit follows a slower schedule. Whether that arrangement is beneficial requires an actual system analysis, including extra equipment and losses. The conceptual advantage is that it can separate the external demand's timescale from the fuel cell's preferred operating trajectory.
That possibility should not become a universal recommendation. Some SOFC designs are explicitly developed for dynamic operation. The relevant comparison is between architectures tested under the intended duty cycle, not between a stereotype of an inflexible ceramic and an equally simplistic promise of instant response.
A rapid-start cell does not establish a rapid-start power plant
Tucker and Ying's 2017 research operated metal-supported cells in a direct-flame configuration and demonstrated rapid startup and repeated thermal transitions in that experimental arrangement. The paper also emphasized the low fuel-to-power efficiency inherent in the configuration. Its results are valuable precisely because power density, startup behavior and fuel efficiency are reported as different characteristics. Metal-supported cells in direct-flame operation.
A small specimen has a different thermal environment from a complete stack and its associated equipment. The energy needed to warm a body depends on its thermal mass and temperature change. Heat-transfer distances, insulation, manifolds and surrounding hardware influence how uniformly and quickly that energy can be supplied. Those relationships make scaling a thermal transition more complicated than multiplying the electrical power.
For a toy calculation, suppose an effective heated assembly has a heat capacity of one kilojoule per kelvin and must be raised by 600 kelvin. Ignoring losses, the required sensible heat is 600 kilojoules. If a larger assembly has ten times the effective heat capacity, it requires six megajoules for the same temperature change. Delivering heat ten times faster would preserve the idealized warm-up time only if the system could distribute it without unacceptable gradients or other constraints.
The calculation deliberately omits many real details. It demonstrates that “time to first power” is an incomplete startup metric. A device can begin producing a small output before it reaches its rated or efficient operating state. A complete startup assessment would distinguish first power, stable output, net export after auxiliaries and readiness to accept the intended load changes.
Shutdown has a similar distinction. Electrical output can cease quickly while the system remains hot and continues to require controlled management. A claim about fast electrical response does not automatically imply fast thermal shutdown, and neither should be confused with an emergency procedure for a real installation.
A fair comparison therefore describes the whole transition: initial state, final state, energy consumed, output delivered and any restrictions on repetition. The startup clock does not stop merely because a voltmeter first registers a useful signal. It stops at the state relevant to the application being discussed.
Expansion has to be compatible across interfaces
A cell contains adjoining materials that do not necessarily expand by the same amount when heated. The simplest linear estimate of free thermal strain is the expansion coefficient multiplied by the temperature change. A bonded assembly cannot always let every layer take its preferred free strain, so a difference that looks small in a material-property table can matter across a large temperature excursion.
For a purely hypothetical calculation, let two adjoining materials differ in expansion coefficient by two millionths per kelvin. Across a 600-kelvin change, their difference in preferred strain is 0.0012, or 0.12 percent. That is a geometric mismatch, not a calculated stress or a prediction of failure. Converting it to stress would require elastic properties, geometry, constraints, temperature dependence and potentially time-dependent relaxation.
The example explains why a generic statement that ceramics tolerate high temperatures is insufficient. Temperature resistance and compatibility within an assembly are different properties. A material can remain chemically stable while a joint or interface experiences an unfavorable mechanical condition. A coating can improve one chemical problem while introducing a different compatibility question.
Uniform temperature is another simplifying assumption. If one part of a component heats faster than another, differential expansion can arise even within the same material. A measured average temperature cannot describe every local gradient. The position and response time of temperature measurements therefore affect how well they characterize a transition.
This is also why a faster warm-up target cannot be evaluated in isolation. Supplying more heat may shorten the average temperature rise while increasing nonuniformity. A successful rapid-start architecture must demonstrate that the relevant components and interfaces tolerate the actual thermal history, not merely that a sensor reaches the target temperature quickly.
The useful design evidence connects temperature fields, material behavior and observed condition after cycling. A model can help identify where to look, while inspection and repeated tests can challenge the model. Neither a uniform-temperature calculation nor a single surviving specimen establishes every interface's durability over the intended duty cycle.
Reforming moves the thermal problem inside the cell
Using a hydrocarbon-derived fuel introduces reactions beyond the electrochemical conversion itself. Internal reforming can reduce the need for a separate external reactor, but it places chemical conversion and heat demand close to the electrode. The spatial distribution of that demand becomes part of the cell's thermal design.
A 2022 project-review poster by Lee and colleagues investigated a high-entropy-alloy anode intended to moderate reforming and resist carbon deposition. The reported evidence came from limited bench and cell tests. In that context, “carbon-free” referred to the absence of detected carbon deposits under the investigated conditions, not to zero carbon dioxide emissions from a hydrocarbon-fueled system. Internal-reforming anode experiment.
An original heat-balance example shows why location matters. Imagine that the same total amount of an endothermic reaction occurs in two cells. In one, most of it occurs near the inlet. In the other, it is distributed more evenly along the flow path. The total reaction heat demand can be identical while the local temperature gradients differ substantially. A system-level heat balance cannot reveal that difference by itself.
The local gradients can then interact with transport and electrochemistry. A region experiencing a different temperature and composition does not necessarily carry the same current density as its neighbor. Treating the cell as a uniform box may be adequate for some overall calculations but inadequate for explaining localized degradation.
This also changes how fuel flexibility should be described. Compatibility with a fuel family does not imply tolerance of arbitrary impurities, variable composition or every operating condition. Fuel preparation remains part of the system. The appropriate question is what fuel specification and operating envelope were actually tested.
For a general reader, the important boundary is between a chemical possibility and an engineered capability. A reaction that is thermodynamically allowed does not establish that it occurs at the needed rate, in the desired place, without unacceptable side effects. The useful cell design has to coordinate kinetics, transport and heat flow, rather than relying on the reaction equation alone.
Fuel utilization has a local meaning
A system can improve its use of incoming fuel while making conditions near the end of a flow channel more demanding. The inlet composition is not the composition everywhere inside the cell. As reactions proceed, reactants are consumed and products accumulate. A single utilization number summarizes that transformation but does not show its spatial distribution.
Moarrefi and colleagues' January 2025 paper compared steam and dry reforming behavior within a fuel-cell framework and examined how temperature, composition and current draw affected the reaction kinetics. The experimental and modeling results support treating reforming and electrochemical operation as coupled processes. They do not make a hydrocarbon-fed device automatically carbon neutral; that would require a separate accounting of carbon sources and destinations. Comparison of steam and dry reforming adsorption kinetics.
Consider an original idealized hydrogen-only flow balance. If ten arbitrary units of usable fuel enter a region and eight are consumed electrochemically, the region's simple utilization is eighty percent. Two units remain at the outlet, along with products and any other constituents. The arithmetic says nothing about whether every parallel channel received the same inlet flow or whether consumption was evenly distributed.
Now imagine two parallel channels receiving different shares of the total flow while being asked to support comparable current. The channel with less available fuel can approach a limiting condition even though the aggregate utilization looks acceptable. Increasing the total fuel supply may reduce the symptom while leaving the distribution problem unresolved. An average can conceal a local constraint.
Recirculation adds another accounting layer. Fuel leaving the stack may be returned to the inlet rather than discarded. A high overall utilization of fresh fuel can coexist with a lower single-pass utilization through the stack. Those two quantities should be named separately. Otherwise a reader may assume the cell consumes nearly all available fuel in one pass when the system achieves its overall result through recirculation.
The distinction also affects auxiliary energy. Moving recirculated gas has a cost, and its composition and temperature influence the design. The benefit cannot be judged solely by the amount of fresh fuel avoided. The system comparison needs to include the resulting electrical output, heat flows and parasitic demand.
This is a case where a favorable headline number can represent competent engineering while still being easy to misread. High utilization is meaningful when the denominator, flow arrangement and local margins are stated. Without those details, it is an aggregate result being asked to stand in for a spatially distributed process.
Efficiency changes when the boundary moves
The stack produces direct-current electricity. A useful installation may need alternating-current output, fuel preparation, air movement, controls and thermal management. Those functions do not disappear because the electrochemical core has no turbine rotor. They belong in the whole-system calculation.
DOE's fuel-cell systems description distinguishes the stack, fuel processing, power conditioning and other supporting equipment. It also notes that internally reforming systems still need appropriate impurity removal. The page is a general architecture guide, not a performance certification for a specific SOFC installation. DOE's fuel-cell systems overview.
A fictional example makes the accounting explicit. Suppose a stack produces 100 kilowatts of direct-current power from fuel entering the chosen boundary at 200 kilowatts of chemical energy. The gross stack electrical efficiency on that basis is fifty percent. If power conversion delivers 96 kilowatts and auxiliaries consume six, the net exported output is ninety kilowatts. The net electrical efficiency is then forty-five percent. All values are invented to demonstrate the boundary, not to characterize a product.
The fuel-energy basis also matters. Higher and lower heating values treat the energy associated with water differently. A percentage expressed on one basis should not be compared directly with a percentage on the other. Converting between them requires the fuel composition and a consistent definition, not an assumption that one label is merely more conservative.
Recovered heat introduces a separate output. If the hypothetical installation supplies fifty kilowatts of genuinely useful heat as well as ninety kilowatts of net electricity, a simple combined-output ratio would be seventy percent on the same 200-kilowatt input basis. That does not make it seventy-percent electrically efficient. Nor does every joule rejected by the system automatically count as useful heat.
The heat needs a user at a suitable temperature and time. A high annual thermal output has little value to a building or process that cannot use it when available. A comparison that assumes continuous heat recovery should identify that assumption. If the useful heat demand disappears seasonally, the annual result can differ from the best operating-point result.
A clear performance report therefore provides several numbers rather than one ambiguous efficiency: gross electrical, net electrical and useful thermal output, all with stated boundaries and conditions. The relationship among them is more informative than selecting the largest percentage and calling it the system's efficiency.
A small degradation rate accumulates into a design decision
Degradation rates are often reported over a specified interval. Their interpretation depends on whether they describe voltage at fixed current, power at a chosen condition or another quantity. The reference value and the treatment of early stabilization matter as much as the unit.
Take a hypothetical stack beginning at 0.80 volts per cell under a fixed test condition. Suppose it loses 0.2 percent of that initial voltage per thousand hours in a linear illustration. After ten thousand hours, the loss is two percent of the initial value, or 0.016 volts, leaving 0.784 volts. After forty thousand hours, the same linear extrapolation gives an eight-percent loss, leaving 0.736 volts.
Those calculations do not predict a real stack's life. They show why a small rate needs a time horizon. They also show why the assumed form matters. If the rate were applied to the remaining voltage rather than the initial voltage, the result would be slightly different. If the mechanism accelerated, slowed or changed after a transition, neither simple extrapolation would capture it.
The electrical consequence depends on how the system is controlled. At fixed current, lower voltage means lower power. Maintaining power by increasing current changes the operating point and can affect fuel demand, heat generation and further aging. A statement that output was maintained does not necessarily mean the stack's underlying condition was unchanged.
The measurement window matters too. Excluding an initial decline can be reasonable when reporting a later steady degradation rate, but the excluded period should remain visible. A customer interested in total delivered energy cares about the whole trajectory. A researcher studying one mechanism may deliberately isolate a particular interval. Those are different analytical purposes.
A useful lifetime projection includes the range of plausible trajectories and the criterion for end of useful life. The criterion could concern output, efficiency, cell imbalance or another defined requirement. “Lifetime” without an endpoint is incomplete. A system can remain physically operable after it no longer meets the performance conditions that made the installation worthwhile.
The practical result is that efficiency and durability cannot be evaluated independently. A design with excellent initial performance but rapid decline may deliver less useful energy over its service interval than a more conservative operating point. Deciding between them requires the time-integrated result, not just a first-day measurement.
Peak power can occur away from the preferred operating point
Another original toy model makes the tension between rating and efficiency explicit. Approximate a cell's voltage over a limited range as E minus rI, where E is a reference voltage, r is an effective resistance and I is current. The electrical power is then EI minus rI squared. In this simplified relation, power reaches its maximum at I equal to E divided by twice r, where the operating voltage is half the reference value.
Real fuel-cell polarization curves are more complicated, and this expression should not be used to select an operating current. Its purpose is to show why the point of maximum instantaneous power need not be the point of best conversion efficiency or durability. Increasing current raises the rate of reaction while also increasing modeled voltage loss. A headline power-density maximum can therefore describe a condition different from the one chosen for long-term service.
Normalization adds another issue. Power per unit active area is useful for comparing electrochemical specimens, but it does not specify the mass, volume or auxiliary demand of the complete installation. A compact active layer can require substantial supporting hardware. Conversely, a lower-area-power design may have advantages elsewhere in the system. The comparison needs both the material-level metric and the relevant installation-level result.
A sensible report shows a range of operating points rather than only the maximum. It identifies which point was used for endurance testing and whether the same fuel composition, temperature and pressure applied. If a peak-power curve and a longevity result come from different conditions, both can remain valid, but they should not be fused into one implied specification. That distinction is central to reading SOFC research fairly: a promising material result is a contribution to system design, not a complete system hidden inside a small specimen.
The energy delivered over time is the meaningful integral
An original arithmetic comparison illustrates this point. Suppose System A begins at 100 kilowatts and declines linearly to ninety kilowatts over a hypothetical 10,000-hour interval. Its average output is ninety-five kilowatts, so it delivers 950,000 kilowatt-hours over that interval, ignoring downtime. System B remains at ninety-three kilowatts throughout and delivers 930,000 kilowatt-hours. In this simplified comparison, A still delivers more energy despite its decline.
Now suppose A also has 500 hours of downtime during which it would otherwise have averaged ninety-five kilowatts. Subtracting 47,500 kilowatt-hours brings its delivered total to 902,500. The ranking reverses. These invented systems are not cost estimates; they demonstrate why initial rating, degradation and availability need to be considered together.
Fuel consumption would add another dimension. Two systems delivering the same electricity can consume different amounts of fuel over the interval. Startup energy and standby consumption can also matter, especially for an application with frequent transitions. A comparison based only on hours at rated operation may miss a substantial part of the intended duty cycle.
Maintenance creates a related distinction between a cell, a stack and an installation. Replacing a stack can restore performance while the surrounding equipment remains in service. That can be a sensible system design, but the replacement belongs in the service and material account. A long-lived installation should not be described as a single original stack running unchanged if that is not what happened.
The decision can be framed around a specified service: deliver a required electrical profile, within defined constraints, over a stated period. That framing makes it possible to compare operating strategies, replacement schedules and supporting equipment. It also prevents a short high-power test from being treated as a complete answer to a long-duration application.
This integrated view is especially important when a device is proposed for flexible operation. The relevant benefit might be availability at selected times rather than maximum annual energy. In that case the service definition should say so. A lower annual capacity factor can be appropriate for one role and uneconomic for another; the number alone does not identify success or failure.
Reversibility adds a mode, not a free efficiency bonus
A solid oxide cell can be developed for operation in both fuel-cell and electrolysis modes. That creates the possibility of storing energy in a fuel and later recovering electricity. The two modes, however, impose different electrical and thermal conditions, and the surrounding storage system has its own losses and constraints.
A FuelCell Energy project presentation in NETL's 2021 collection set out objectives for reversible solid oxide energy storage and listed anticipated performance targets. Those targets are not reported here as achieved system results. The distinction is particularly important when an attractive round-trip-efficiency number appears in a development document alongside an architecture diagram. Reversible solid oxide project presentation.
For an original simplified example, suppose a charging process converts eighty percent of an electrical input into stored chemical energy on a consistent basis, and a discharge process converts sixty percent of that stored energy back into electricity. Multiplying the two gives forty-eight percent before adding any further storage or auxiliary losses. Neither stage's efficiency can be quoted as the round-trip result.
Heat integration can change the accounting, which is why the boundary must be explicit. If heat is supplied from outside the chosen electrical boundary, a high electrical conversion ratio does not mean the process used no other energy. If useful heat is recovered elsewhere, its value depends on how it is used. Comparing electrical-only and combined-energy figures without those distinctions creates apparent gains that may be accounting changes.
Mode switching also needs its own durability evidence. A long test in fuel-cell mode and a separate long test in electrolysis mode do not automatically demonstrate repeated switching between them in one system. The transition can expose different temperature, composition and polarization histories from either steady state.
A reversible architecture may be useful, but the claim should match the demonstrated scale. A cell experiment can establish electrochemical behavior. A stack experiment can add evidence about distribution and integration. A complete system test can include storage, controls and net energy flows. Each level closes a different set of uncertainties; none should be silently substituted for another.
The two clocks meet at the intended duty cycle
The engineering question is ultimately a schedule. How long will the system remain hot? How often will it change output? What fuel variations are expected? What happens during maintenance or an interruption? Which components remain in service when a stack is replaced? These questions determine which laboratory results are relevant.
A steady industrial application may reward a design that performs well over long continuous operation. An intermittent application may place greater weight on transitions, standby energy and the ability to recover its operating state. A system serving both roles may need a carefully chosen compromise or supporting equipment that separates their timescales.
The evidence should therefore be assembled around a duty cycle rather than around a collection of best-in-class numbers. That means matching the test temperatures, fuel conditions, current histories and transition definitions to the proposed service. Where the match is imperfect, the extrapolation should be visible and tested where it matters most.
The microscopic and system perspectives then reinforce one another. A changed electrode network helps explain a voltage trajectory. A local temperature pattern helps explain why a region ages differently. A revised operating strategy can reduce a damaging transition but introduce standby losses. The useful design is the one that balances those effects for the actual service, not the one that maximizes one isolated metric.
Solid oxide fuel cells can turn chemical energy into electricity through an unusually compact electrochemical core. Keeping that core useful requires attention to everything around and within it: connected microscopic pathways, compatible materials, distributed reactions, controlled transitions and honest system boundaries. The hours counter records only part of that history. The second clock records how the machine moved between those hours, and often explains why two apparently similar lifetimes are not similar at all.