
Metal additive manufacturing can watch a melt pool, map internal voids and model a loaded component. Quality depends on connecting those observations to the right failure mechanism—not on making any one measurement look perfect.
Four specimens, two definitions of a good image
On July 2, 2026, Justin P. Miner and colleagues published a study with an awkward result for anyone who equates a better-looking reconstruction with a better engineering answer. They compared methods for identifying pores in X-ray computed-tomography scans of additively manufactured titanium fatigue specimens. When coupled to the study's fatigue-based ranking, a neural segmentation method identified the fatigue-initiating pore in all four test cases, while the other methods did so in three. Yet the neural method scored worse on common measures of image overlap. The study is small and specific, but its distinction is important: agreement across an image and identification of the mechanically decisive feature are different objectives. Miner and colleagues
An image contains many places that matter little to a particular question and a few that may matter greatly. A metric that treats every location equally can reward excellent agreement over the easy majority while underweighting a consequential disagreement. That does not make the metric useless. It means the metric must be matched to the purpose for which the image will be used.
Metal additive manufacturing brings this problem into focus because its quality evidence comes from several scales. Light from a moving melt pool describes an evolving process. A scan of the finished part describes reconstructed internal structure. A mechanical test describes a response to a particular loading history. None of these observations is a substitute for the others simply because it is precise, expensive or computationally sophisticated.
The central question is not whether metal printing can make useful parts. It is how a claim about a process becomes a claim about a specific finished component. That journey crosses physical transformations and inferential gaps. Understanding those gaps explains why a stable process signal, a high density and a convincing simulation can each be encouraging without individually proving fitness for service.
A part is more than the shape that was requested
In laser powder bed fusion, a beam selectively melts regions of successive powder layers. The finished geometry is built through repeated melting and solidification rather than carved from a previously consolidated block. That brief description already contains several distinct objects: the intended geometry, the material deposited, the thermal history and the solid that remains. Treating them as one object obscures where uncertainty enters.
The design file can specify an external form without fully specifying the material state at every point. Two objects with the same outline can differ internally. Conversely, two objects made from the same nominal alloy can differ in geometry, surface condition and loading environment. The phrase “same material” is therefore incomplete unless the property of interest and the relevant processing state are stated.
Consider an original fictional pair of brackets, identical in mass and external dimensions. One will experience a nearly constant load in a sheltered environment; the other will experience repeated loading and unloading. A tensile-strength result might inform both designs, but it does not by itself supply the repeated-load behavior of the second. The distinction arises from the question asked of the material, not from a change in its name.
Quality evidence is best read as a set of relationships. Process observations may correlate with internal features. Internal features may influence local stresses. Those stresses interact with the surrounding material and loading history. A study that establishes one relationship has made progress, but it has not necessarily established the complete sequence for every component geometry.
This is also why “defect-free” can be an unhelpful shorthand. Every examination has a detection capability, and every application has requirements. A more meaningful statement identifies what was sought, how it was measured and what criterion was applied. The absence of a reported indication is a statement about that examination, not a declaration that the material contains no structure below the instrument's reach.
Feedback can stabilize a process without certifying its output
Ho Yeung's final paper on real-time feedback control became available online on November 29, 2025. Experiments on nickel-alloy 625 plates used measured melt-pool area to inform laser-power adjustments, with a reported measurement-to-power-adjustment reaction time of approximately one hundred eighteen microseconds. The paper demonstrates improved process stability under the tested conditions and presents a route toward adaptive control. It does not establish that every stabilized signal corresponds to an acceptable three-dimensional production part. The linked final paper's date and journal differ from the earlier metadata on NIST's landing page; the final paper is the reference used here. Yeung
Feedback acts on what can be measured quickly enough to influence the process. If the chosen measurement is melt-pool area, then maintaining that area is the immediate control objective. Final fatigue life is not measured on the same timescale. Connecting the immediate objective to the final property remains an experimental task, even when the controller performs its immediate job well.
The dimensional challenge can be illustrated without prescribing a machine setting. In a fictional moving process traveling at eight tenths of a metre per second, a delay of one hundred fifty microseconds corresponds to one hundred twenty micrometres of travel. That distance is simply speed multiplied by time. Halving the delay halves the travel distance, provided the assumed speed remains fixed. These invented values describe timing, not a recommended laser process.
The calculation clarifies why the word “real-time” is relational. A response that is prompt for an overall build may be late relative to a small, rapidly changing region. Equally, an extremely fast response is not automatically useful if the measurement does not distinguish the conditions relevant to the intended correction. Timing and observability are separate requirements.
A convincing control demonstration therefore states both what was regulated and what was independently checked afterward. The first shows that the feedback loop behaves as intended. The second tests whether that behavior produces the desired material outcome. Collapsing those two claims into one can make a successful control experiment appear to have solved a qualification problem it was not designed to answer.
The build plate is not a uniform neighborhood
Jordan Weaver and colleagues investigated how non-uniform gas speed across a build area relates to melt-pool depth in a 2023 study. They combined single-track cross sections with measurements of the gas-speed profile and compared locations and scan circumstances. The results showed substantial variability and condition-dependent trends. This is evidence that a nominally shared process can encounter spatially different conditions within one build, not a universal correction rule or a transferable production recipe. Weaver and colleagues
That observation makes the placement of test material important. A witness specimen made beside a component is attractive because it shares some history with the component. But proximity is not identity. It can share a powder batch and a build session while experiencing a different local environment or thermal neighborhood. A representative specimen is therefore a claim to be demonstrated, not a status conferred by being printed nearby.
An imagined build provides a simple statistical example. Suppose four positions are sampled, and the measured quantity differs systematically from left to right. If all test specimens occupy the left side and all production parts the right, a difference between the two groups cannot be cleanly attributed to their geometry. Position and object type have been confounded. Repeating the same arrangement many times makes the pattern more precise without separating its causes.
A different comparison, in which object types are represented across positions, could help distinguish those explanations. This is a general experimental-design principle, not an instruction to rearrange a qualified industrial build. The important point for interpreting a paper is whether its comparison supports the conclusion it draws. Large sample counts cannot repair a comparison whose key influences move together.
Spatial variation also changes how averages should be read. A build-wide average can remain constant while the distribution becomes less uniform. If one region becomes hotter and another cooler by corresponding amounts, the mean may hide both changes. Reporting local variation is not merely adding detail; it can expose a quality-relevant difference that the summary statistic is mathematically unable to show.
A signal from one layer is not the final interior
Jesse Redford and colleagues presented an October 2025 conference study of how seeded defects evolve across subsequent layers in nickel-alloy 625. The three-page paper describes a broader specimen set but presents initial results for open-hole defects. Its cross-sectional observations address persistence and transformation during later processing. The distinction matters: a real indication at one stage may be altered afterward, so agreement between an in-process detector and final inspection cannot be interpreted without considering when each observation was made. Redford and colleagues
A manufacturing process does not merely reveal a fixed object. It creates and changes the object while measurements are being collected. That makes the target of detection time-dependent. If the target is “an unusual condition existed during this layer,” a later absence does not necessarily refute the earlier observation. If the target is “a persistent void will remain in the finished part,” the same later absence has a different meaning.
This can be expressed with an original fictional ledger containing two columns. Column one records whether a temporary feature was independently present at an intermediate stage. Column two records whether a corresponding feature remains at completion. A detector of the intermediate state is evaluated against column one. A predictor of the final state is evaluated against column two. Mixing the columns would penalize or reward the system for answering a different question.
The distinction also prevents an easy overclaim in the opposite direction. Observing that some features change or disappear does not imply that later processing reliably repairs every harmful condition. It establishes that persistence needs investigation. The appropriate conclusion is neither “every early anomaly is a final defect” nor “later layers will fix it.” Both statements go beyond the evidence.
For researchers combining process images with final scans, temporal correspondence is therefore part of the dataset. A label should identify the state it describes and the stage at which that state was established. Otherwise, a model may be trained on apparent contradictions that arise not from poor sensing but from an object that genuinely changed between observations.
A voxel is a box in a reconstruction, not a guaranteed visible pore
Felix Kim and colleagues published a model-assisted investigation of X-ray computed-tomography detection on January 27, 2021. They combined measurements of reference artifacts with simulated observations and explicitly included uncertainty in the reference flaw sizes. Their analysis also considered imaging thresholds and flaw location and orientation. The study shows why detection capability belongs to an examination process with uncertainty, rather than being determined by voxel dimensions alone. Kim and colleagues
A voxel is a small volume element in the reconstructed image. Its size tells us how the reconstruction is sampled. It does not, by itself, tell us the smallest feature that can be reliably distinguished from noise and surrounding material. A feature can occupy several voxels and remain difficult to identify, or affect voxel values without being cleanly resolved as a separate object.
Geometry makes this distinction tangible. Imagine an ideal spherical cavity with a diameter of thirty micrometres in a reconstruction using ten-micrometre cubic voxels. Its volume is about fourteen thousand one hundred cubic micrometres, equivalent to roughly fourteen voxel volumes. That does not mean fourteen neat, fully empty cubes appear in the image. The sphere's boundary cuts through the grid, and its position relative to the grid changes which voxels contain mixtures of material and void.
This is an invented geometry exercise, not a detection prediction. It deliberately omits imaging blur, noise and reconstruction effects. Even in this ideal case, counting voxel volumes is not equivalent to counting perfectly classified voxels. The real examination adds further reasons why sampling dimensions and detection performance should not be treated as synonyms.
The consequence for a quality claim is that “scanned at this resolution” is only part of the evidence. A reader also needs to know whether the relevant feature class was detectable under the actual examination conditions. A smaller nominal voxel can be useful, but its value must be demonstrated in the context of the specimen and the question, rather than inferred from the number alone.
Image overlap can reward the wrong pixels
Segmentation assigns reconstructed locations to categories such as metal and void. One common overlap measure, the Dice coefficient, compares the shared portion of two segmentations with their total labeled volume. It is useful for describing agreement, but it weights agreement by the amount of labeled material rather than by mechanical consequence. The definition itself contains no knowledge of which pore might initiate a crack.
Here is a completely fictional example. A reference image contains one thousand labeled pore voxels. A candidate segmentation identifies nine hundred of them and adds no others. Its Dice coefficient is twice nine hundred divided by the sum of one thousand and nine hundred, or approximately zero point nine four seven. That looks like strong overlap, but the calculation does not say where the missing hundred voxels are.
If the missing voxels are spread harmlessly across boundaries irrelevant to the intended analysis, the consequence may be modest. If they form one consequential feature, the engineering interpretation may change substantially. The overlap score is identical in both versions of the example. No amount of additional decimal precision in that score can reveal information the score has deliberately discarded.
The reverse is possible too. A segmentation can make numerous small disagreements while preserving the feature that matters most to a particular mechanical prediction. That does not excuse poor image reconstruction; other tasks may require those boundaries accurately. It does show why evaluating an image algorithm requires more than choosing one universal quality number.
The appropriate test depends on the downstream use. Measuring total void volume, locating an extreme feature and estimating a surface-connected geometry are different tasks. A method can be good at one and inadequate at another. Calling the reconstruction “accurate” without naming the task invites the reader to supply a stronger meaning than the evaluation supports.
Average density hides the arrangement of empty space
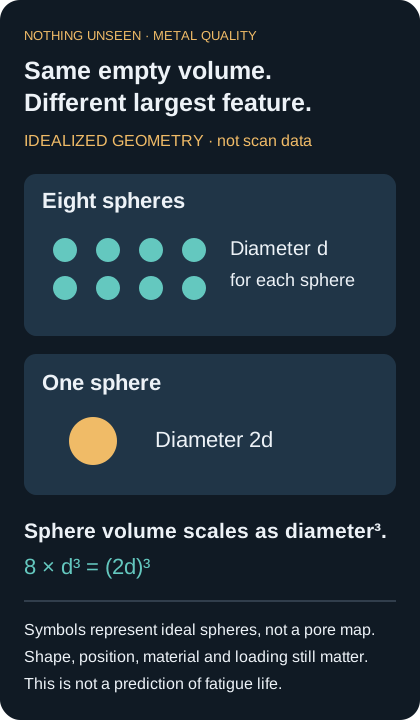
Idealized geometry, not measured pores. Eight spheres of diameter d have the same total volume as one of diameter2d. Equal total void volume does not specify the largest feature; this is not a fatigue prediction.
Two components can have the same total void volume and very different distributions of that volume. A density measurement summarizes how much material is present within a chosen volume. It does not retain every void's size, shape or location. The information loss is mathematical, not a defect in the measurement: a summary cannot preserve all the structure of the object being summarized.
Imagine two idealized samples, each containing the same amount of empty space. In one, that space is divided among a thousand equal spherical cavities. In the other, it forms a single sphere. Because a sphere's volume scales with the cube of its diameter, the single sphere has ten times the diameter of each small sphere. Total void volume is unchanged, but the largest feature is very different.
This is a geometric comparison, not a prediction that one fictional sample will fail first. The mechanical consequence would depend on additional information, including location and loading. Its purpose is to show exactly what a bulk porosity fraction cannot tell us. Equal fractions do not logically imply equal extreme features, and equal extreme sizes do not logically imply equal mechanical behavior.
Location introduces another distinction. A component is not necessarily stressed uniformly, and a void's position relative to a surface can change the relevant geometry. A global percentage has no coordinate system for those effects. Even a complete inventory of void sizes may be insufficient if it discards where those voids occur.
The practical reading habit is to ask which representation a paper uses. A density value, a size distribution and a spatial map are not competing versions of the same number. They preserve different aspects of the material. A strong quality argument selects the representation needed for the application, rather than treating whichever measurement is easiest to obtain as a complete description of the part.
A witness coupon must earn the right to represent a part
In a preprint submitted on November 5, 2024, Miner and Sneha Prabha Narra examined porosity equivalence between two titanium fatigue-specimen geometries made under the same process conditions. Their analysis incorporated uncertainty in upper-tail statistics rather than relying on one estimated largest pore. The resulting distributions did not make one specimen geometry a straightforward representative of the other. This is an original statistical and measurement study, explicitly cited here as a preprint, and not a universal rule that witness coupons are either valid or invalid. Miner and Narra
The underlying sampling problem has a simple independent illustration. Suppose, purely hypothetically, that each of a set of independent material regions has a one-percent chance of containing a specified rare feature. The probability that none of ten regions contains it is zero point nine nine raised to the tenth power. The probability of at least one is therefore about nine point six percent. Across one hundred such independent regions, the probability of at least one rises to about sixty-three point four percent.
Those are invented probabilities, not measured pore statistics. Real material regions need not be independent or identically distributed. The calculation shows why the volume examined can affect the chance of encountering an extreme feature even when a local probability remains unchanged. A larger object can offer more opportunities for a rare event without having a worse average local process.
Scaling from a small coupon to a larger component therefore requires assumptions. If the regions differ systematically or their features are clustered, the simple independent-region calculation does not apply. The relevant distribution must be supported by measurements and a defensible model, with uncertainty retained through the scaling step.
A useful coupon is not merely a miniature object that looks tidy in a test report. It is a proxy for a specified aspect of the component's material state. That proxy may work for one property and fail for another. Demonstrating tensile behavior in a coupon does not automatically establish the extreme-defect population in every stressed region of a much larger part.
Finishing changes the material question
Julian Emanuel Gunther Schulz and colleagues published a titanium-alloy study on September 18, 2025, comparing intentionally different porosity conditions, surface states and post-processing treatments. They used tensile and rotating-bending fatigue tests. Their results distinguish the influence of as-built roughness from internal porosity and show that a treatment affecting internal defects does not erase every surface-related limitation. The findings concern the tested alloy, specimens and treatments; they are not a blanket assurance that post-processing restores any printed part to an acceptable condition. Schulz and colleagues
A finished component is the product of the whole route, not just the build. Removing material, changing thermal history or applying pressure can change which features remain relevant. A process qualification argument therefore needs to identify the state in which properties were measured. “Printed titanium” is too broad a label if the comparison mixes surfaces and treatments that differ in consequential ways.
Imagine a fictional specification that requires both dimensional compliance and a defined mechanical response. A finishing operation could improve the surface while changing a thin feature's dimensions. Another operation could change internal structure while leaving an inaccessible surface untouched. Success on one requirement would not automatically establish success on the other. The requirements remain distinct even when the manufacturing steps are tightly connected.
This is also why before-and-after comparisons need stable definitions. If a study reports improved performance after processing, the reader should ask what changed besides the targeted feature. A treatment may alter several material attributes at once. The overall improvement can be genuine while the attribution to one particular mechanism remains uncertain.
The clearest report does not need to claim that only one thing changed. It can state that a complete route produced a particular result, then distinguish that route-level evidence from a mechanism-specific explanation. That distinction is useful to anyone considering transfer to another geometry, because the other geometry may not respond to every step in the same way.
A buried feature can become a surface feature
Bardia Hejazi and colleagues studied fatigue cracks in electron-beam powder-bed-fused titanium specimens, publishing online on October 26, 2024, ahead of a 2025 issue. Their specimens included deliberately created internal cavities, and X-ray tomography supported three-dimensional crack characterization. They also found that lack-of-fusion features exposed at the surface after machining could be as detrimental as the internal artificial defects in their tests. This is electron-beam processing and a particular fatigue experiment, not a direct validation of every laser-built geometry. Hejazi and colleagues
The geometrical lesson is that “internal” describes a relationship to a boundary. Change the boundary and the relationship can change without moving the feature itself. A pore map taken before finishing therefore needs to be interpreted in the coordinate system of the finished component if the final surface matters to the analysis.
A simple fictional cross section makes the issue visible. Suppose a cavity's nearest point is one and a half arbitrary length units below the original surface. Removing a layer two units thick would intersect it. The cavity has not migrated toward the surface; the surface has moved toward the cavity. This example is a geometric statement, not a machining allowance or a prediction of the resulting mechanical behavior.
Registration between measurements becomes important here. A scan, a design model and a record of removed material must refer to compatible coordinates before they can be combined. An apparently precise distance from a feature to a surface is meaningless if the two were measured in different states or their alignment is uncertain.
This problem extends beyond any single finishing operation. The question “where is the feature?” has to include “relative to which version of the part?” A quality record that preserves only the original design can lose the relationship needed to interpret later measurements. Traceable transformations between states are therefore part of the evidence, rather than administrative details attached after the science is complete.
Residual strain is not another name for porosity
Thien Phan and colleagues published location-specific residual elastic-strain measurements of nickel-alloy 718 benchmark artifacts on January 8, 2025. Their study used energy-dispersive synchrotron X-ray diffraction and assessed measurement uncertainty while comparing results with modeling predictions. This probes a different aspect of material state from a tomography map of voids. It provides benchmark evidence about strain within particular builds, not a universal residual-stress correction for printed metal. Phan and colleagues
Elastic strain describes a fractional change in spacing or dimension relative to a reference state. Converting it into stress requires an appropriate mechanical relationship and assumptions about direction and material behavior. A material can look geometrically complete while retaining internal elastic strains. Conversely, a porosity map does not contain all the information required to reconstruct that strain field.
For a deliberately simplified one-dimensional example, take an imagined elastic modulus of one hundred seventy gigapascals and an elastic strain of one hundred microstrain. Multiplying them gives seventeen megapascals. The arithmetic uses a linear uniaxial relationship and invented values. It is not a residual-stress determination for any alloy in this article; a real multiaxial interpretation requires more information than the example supplies.
The example shows why a reference matters. A small uncertainty in the strain-free spacing can affect an inferred strain, which then affects the stress estimate. Reporting many digits in the final stress does not remove uncertainty in that reference. Nor does a dense spatial map make a simplifying material assumption disappear.
Different measurement methods can therefore be complementary without needing to agree on a single scalar quality score. One describes internal void geometry; another describes elastic strain; another examines crystal structure. Combining them can constrain a richer picture of the material. Averaging their outputs into an unexplained quality number would discard the physical distinctions that made the measurements valuable in the first place.
Grains make a small specimen a particular specimen
Orion Kafka and colleagues' report on an AM-Bench 2022 tensile challenge, published in 2023, asked modelers to predict the behavior and fracture of a small nickel-alloy specimen. The supplied information included grain-related surface measurements and three-dimensional pore information. Six groups submitted predictions, and no model performed best across every requested quantity. The challenge concerns a specimen whose thickness contains relatively few grains, and it is a tensile benchmark rather than a fatigue-life certification. Kafka and colleagues
A material's nominal alloy composition does not specify the arrangement and orientation of its crystals. At scales containing only a few grains, the particular arrangement can matter to a local response. A small specimen is therefore not automatically a scaled-down sample of an averaged continuum. Its dimensions and microstructure jointly define the question posed to a model.
An analogy with arithmetic averages helps without pretending to be a crystal-plasticity model. Imagine two fictional groups, each with an average value of five. One contains the values five and five; the other contains one and nine. The mean is identical, but the local variation is not. If the outcome depends on the most extreme member or on how adjacent members interact, the mean alone cannot determine it.
Likewise, a model can reproduce an average response while locating a highly localized event incorrectly. That is not necessarily a contradiction. The two predictions demand different information and may expose different weaknesses in the model. A benchmark that asks for several outputs can reveal this distinction more clearly than one that reports a single global fit.
The important achievement of such exercises is not anointing a universally best model. It is identifying which aspects of behavior are predictably captured and which remain sensitive to missing information, assumptions or numerical treatment. That knowledge is useful when choosing what a model may legitimately support in a component-level argument.
The scan can change while the specimen is being loaded
D. Hertz-Eichenrode and colleagues published an in-situ tomography and tensile-loading study of additively manufactured stainless steel on April 17, 2025. The specimens contained tailored pre-existing voids that made their evolution easier to observe. The researchers tracked changes during loading and related the structure before failure to the fracture surface. Some increases in detected void population occurred because deformation made existing features detectable. This is a tensile deformation experiment, not a cyclic-fatigue study, and its tailored void population should not be mistaken for an unselected production population. Hertz-Eichenrode and colleagues
A count of detected objects can change for two broad reasons: the objects change, or their visibility changes. In a deforming specimen, both may happen together. Interpreting a larger count as proof that entirely new voids formed would therefore require separating those possibilities. The measurement process is part of the explanation, not merely a transparent window onto it.
An original fictional image series illustrates the distinction. At the first observation, a reconstruction identifies forty features above its effective visibility threshold. At a later observation, it identifies fifty. If ten previously sub-threshold features became easier to distinguish, the count rose without ten new features appearing. If some features merged while others became visible, even the net increase would hide several different processes.
The correct analysis follows identities and geometry where possible, rather than relying only on totals. Yet identity tracking introduces its own uncertainty: a shape may deform, neighboring features may connect, and the reconstruction may no longer separate them in the same way. A one-to-one correspondence should be demonstrated, not assumed because two images belong to the same specimen.
This is why observing an evolving material can be more informative than examining it only after failure. The sequence can constrain possible explanations. It does not eliminate the need to understand visibility, loading state and reconstruction. A time series adds a new dimension of evidence, and with it a new set of questions about what remained comparable from one observation to the next.
Geometry decides where a material property is used
A component-level assessment needs more than a material label because the component redistributes loads. A nominal stress calculated from total force and area is an average over a chosen section. Local geometry can produce a different distribution. Without that distinction, a material test result may be compared with a component calculation that describes a different physical quantity.
Take an original, intentionally elementary example. A fictional straight member carries a force of one thousand newtons through a cross-sectional area of one hundred square millimetres. Its nominal axial stress is ten newtons per square millimetre, or ten megapascals. Reducing the area to fifty square millimetres doubles that nominal value under the same force. This calculation says nothing about local concentrations, bending, instability or material failure.
Those omissions are the point. A simple equation can be correct and incomplete at the same time. If the member contains a geometric transition or a complex internal channel, a single average may not describe the region relevant to initiation of damage. A detailed model can help, but its additional complexity must be supported by appropriate boundary conditions and material assumptions.
It follows that a pore judged unimportant in one location cannot automatically be judged unimportant elsewhere. The feature's significance depends on the demand placed on its surroundings. A material examination and a structural analysis need compatible coordinates and definitions to make that connection. Neither can simply hand the other an unexplained pass mark.
The same reasoning limits transfer between specimens. A smooth test bar, a thin wall and a lattice feature may share an alloy and build process while differing in surface-to-volume ratio and load distribution. A study can support a useful material model for a defined range without proving that every geometrical use of that material is acceptable. The qualification claim should be no broader than the chain of evidence connecting the tested state to the intended one.
The manufacturing record must survive the transformations
A finished part has passed through states that may no longer be directly observable. Powder became melt; melt became solid; later processing changed surfaces and internal structure; examination converted signals into interpreted features. A useful quality record preserves enough of those transformations to explain which observation belongs to which state. This is a proposed evidential standard, not a claim that a particular commercial system already supplies it.
Imagine trying to connect an unusual process image to a void in a final scan. The two records must refer to compatible locations, and the analysis must account for changes between the observations. If the part has been cut, moved or finished, the coordinate transformation matters. A very accurate image on each side does not guarantee an accurate correspondence between them.
There is a similar problem with software. A segmentation produced by one version of an algorithm is not necessarily identical to the segmentation produced later from the same raw scan. Preserving only the final colored rendering can make it impossible to distinguish a material change from an analysis change. Retaining the underlying data and the interpretation history allows disagreements to be investigated rather than overwritten.
The record should also distinguish a measurement from a decision. A measured feature may be judged acceptable under one documented requirement and unacceptable under another. The observation has not changed; the intended use or criterion has. Keeping the two separate makes it possible to revisit a decision without pretending that the original measurement was different.
Such traceability is not a replacement for qualified engineering judgment. It is what makes that judgment inspectable. When an unexpected result appears, the organization needs to know whether the uncertainty arose in manufacture, measurement, interpretation or the link to service demand. A record that preserves only a final green indicator removes precisely the distinctions needed to learn from the result.
Quality is a claim with an address
The most useful advances in metal additive manufacturing do not all point toward one universal sensor. Some improve control of a rapidly changing process. Others improve characterization of the finished interior, interpretation of surfaces or prediction of local response. Their value lies in answering different questions well and making the connections between those answers more defensible.
That is why an impressive measurement needs an address: the material, geometry, processing state, observation conditions and intended use to which the claim applies. Removing those qualifications can make the result sound stronger while making it less useful. A reader cannot judge transfer to a new component if the original domain has been blurred into “metal printing.”
A defensible argument can contain several modest statements rather than one sweeping assurance. The process stayed within a demonstrated range. The examination had a characterized capability for the relevant features. The finishing route was represented in the tests. The mechanical model was checked against measurements appropriate to its purpose. Each statement contributes something specific; none should be silently promoted into the complete conclusion.
The pore that starts a crack may occupy a tiny fraction of an image. The assumption that determines whether it matters may occupy only a sentence in a methods section. Both deserve attention disproportionate to their size. Better manufacturing evidence is not simply more pixels, more sensor samples or more computational detail. It is a better account of which details carry the decision—and which attractive summaries leave those details out.