
The strongest eruption forecasts connect signals to possible physical processes, then test what was known before the outcome. A promising precursor is not a universal countdown.
The interesting part is not the success percentage
On December 17, 2025, François Beauducel and colleagues published a study of an eruption-precursor tool at Piton de la Fournaise. Its version of record followed on December 29. The method detects very-low-frequency ground-motion transients associated with fracturing and magma injection; its name, Jerk, refers to the rate of change of acceleration. For the operational period from 2014 through 2023, the authors reported timely alarms before twenty-two of twenty-four eruptions, two late alarms, two intrusions without eruption and twelve other negative cases. Their reported true-positive and false-positive rates therefore use different denominators. The result is an evaluation at a particular volcano under specified monitoring conditions, not a universal eruption clock. Beauducel and colleagues
The scientific attraction lies in connecting a measurable signal to a process underground. The interpretive difficulty lies in the next step: a process associated with eruption need not finish as an eruption. Identifying movement, identifying its cause and identifying its eventual outcome are three different achievements. A forecast can improve at the first two while remaining uncertain about the third.
That distinction changes how a reader should approach an impressive headline. Instead of asking only whether a method “works,” ask what it detects, which events it was asked to anticipate and what counted as enough notice. A correct signal after the event begins may be useful for understanding the event but cannot serve as advance evidence. A correct observation of subsurface change may still be a false alarm for a more specific target.
The subject here is that chain of inference, not how emergency messages are delivered. Nor is this a current assessment of any volcano's safety. The examples concern published studies and clearly labeled fictional calculations. Actual hazard decisions require the responsible observatories and authorities, not an isolated percentage extracted from an article.
A volcano is not an appointment book with a date waiting to be decoded. It is a changing physical system observed through incomplete measurements. Forecasting becomes credible when it preserves the difference between what has changed, what could happen next and what has actually been demonstrated about the ability to anticipate it.
Begin with the event, not the instrument
Before comparing methods, define the thing being forecast. The onset of a surface eruption is not the same event as the arrival of magma at a shallower level. A particular explosive episode during continuing activity is not the same target as the start of a new eruptive period. A collapse at an already active volcano is another target again. Each can have an important scientific question attached to it, but the answers cannot be pooled merely because they involve a volcano.
Imagine a fictional research program with three recorded outcomes: an intrusion, a surface outbreak and a larger explosion. A sensor responds to every intrusion. If every large explosion is preceded by an intrusion, that sensor might be relevant to forecasting explosions. It would not follow that every response predicts an explosion. The implication works in one direction, not automatically in both.
The time window belongs in the target too. “An eruption eventually” is much easier to satisfy than “an eruption within the next day.” A forecast that remains active indefinitely can accumulate successes without telling anyone much about timing. Conversely, a narrowly defined window can turn a physically related signal into a statistical miss if the event falls just outside it. Neither convention is inherently dishonest; the convention must be fixed and visible.
Location and event size introduce further distinctions. A method might anticipate renewed activity without locating the vent. Another might identify a likely sector while remaining uncertain about the date. A third might assess whether an episode will become more energetic after it begins. Calling all three eruption prediction hides the capabilities that actually differ.
An original forecast record could therefore contain a plain-language target sentence before any probability: which event, where, within what interval, and against what observation will it be judged? That sentence is part of the scientific object, not administrative decoration. Without it, two groups can announce apparently contradictory results while answering different questions.
This discipline also keeps observations useful when they do not settle the headline question. A well-supported finding of intrusion remains important even if no eruption follows. The value of the observation does not require quietly redefining the original forecast after the outcome is known.
Unrest has branches that stop short of eruption
An Alaska Volcano Observatory statement dated July 29, 2025 described a stalled shallow intrusion beneath Mount Spurr while retaining the possibility of deeper activity. It discussed multiple observations rather than equating one signal with an inevitable eruption. That bulletin is a historical account of an evolving interpretation; its assessment must not be presented as the volcano's current condition in November 2026. AVO's dated Spurr statement
The general inference is easy to understand with a fictional branching diagram. Suppose an observed change supports the proposition that material has moved underground. The next branch asks whether that movement continues, stalls or changes direction. A later branch asks whether it reaches the surface. The first observation can be informative even when the later branches remain uncertain.
This is why a quieting signal should not automatically be translated as either “nothing happened” or “the danger is over.” It may indicate a change in the process, a change in how the process is observed or a return toward an earlier state. Choosing among those interpretations requires additional evidence. A time series by itself does not supply the labels a reader wants to place on its rise and fall.
Consider an invented sequence in which earthquake counts increase while a deformation estimate stays nearly unchanged. That is not necessarily a contradiction. The observations measure different things and have different detection limits. A researcher might investigate several explanations before deciding whether the combination changes the forecast. Averaging the two signals into a single reassuring or alarming score could erase the disagreement that deserves attention.
The same applies to apparently consistent observations. Two instruments may share a disturbance, processing assumption or spatial blind spot. Agreement can strengthen an interpretation without establishing complete independence. A useful analysis asks what each observation adds that was not already contained in the others.
In this view, a forecast update is not a confession that the previous scientific work was meaningless. It is a new statement conditioned on a changed information set. The important accountability question is whether the change is documented and justified, not whether the volcano fulfilled a simple narrative of steadily increasing unrest followed by eruption.
A sealed pathway can change the meaning of gas
Sophie Pearson-Grant, Michael Heap and Adrian Croucher's December 2025 study used three-dimensional numerical models, informed by field and laboratory data from Whakaari, to examine heat and fluid flow. Their modeled low-permeability mineralized seals could retain steam and magmatic gases, allowing pressure to rise. The study investigates a mechanism and its possible observable consequences; it is not a prospective demonstration that every seal failure can be timed from surface measurements. Pearson-Grant and colleagues
The model provides a reason not to read an escaping flux as a direct inventory of everything below ground. In an elementary accounting picture, accumulation equals input minus output. If input stays constant while an exit becomes less effective, material can accumulate even as the measured output declines. This is a conceptual balance, not a calibrated model of a named volcano.
For an invented example, let a system receive ten arbitrary units per interval and release nine. Its stored amount increases by one. If the release falls to six while input remains ten, storage increases by four. A smaller observed output accompanies faster accumulation in this simplified case. If input instead falls to five, the same output of six accompanies decreasing storage. The output alone cannot distinguish those histories.
The missing variable is therefore not a small technical inconvenience. It determines which interpretation the observation supports. A field measurement may constrain one term of a process while leaving another weakly known. Additional observations are useful when they help separate those possibilities, not simply because they increase the number of lines on a dashboard.
There is also a difference between a model that can generate a behavior and evidence that the behavior caused a particular event. A plausible mechanism explains why an observation deserves investigation. Establishing that it operated requires tests against the alternatives and the actual conditions. The fictional balance above does not establish underground pressure, material properties or an eruption threshold.
That boundary is especially important when an accessible metaphor becomes memorable. A blocked kettle may help someone imagine retained fluid, but a volcanic hydrothermal system is not literally a kitchen vessel. The model's geometry, material assumptions and observations carry the scientific argument; the metaphor cannot replace them.
A repeated pattern is a hypothesis about a process
Alberto Ardid and colleagues' April 20, 2022 study analyzed eighteen well-recorded eruptions across New Zealand, Alaska and Kamchatka. It identified changes in a ratio of seismic amplitudes in different frequency bands and interpreted the pattern in relation to hydrothermal sealing and pressurization. The authors proposed that monitoring the precursor could improve forecasts at certain volcanoes. The interpretation and its bounded transferability should not become a claim that one signal universally precedes all explosive activity. Ardid and colleagues, 2022
Ratios can reveal behavior that a total conceals. Imagine two fictional signal bands, each initially assigned an amplitude of ten units. Their ratio is one. If both double, the ratio remains one even though the total rises. If the first doubles and the second stays unchanged, the ratio becomes two. The two summaries answer different questions; neither is a complete description of the underlying motion.
A ratio also inherits uncertainty from both parts. If its denominator becomes very small, modest absolute changes can produce large relative swings. Before attaching a physical interpretation, an analysis needs to know whether the pattern is robust to the measurement and processing choices. A dramatic curve can result from a meaningful redistribution of energy, but its dramatic appearance alone does not establish that explanation.
The scientific task is to connect a repeatable statistical feature with a plausible physical sequence while keeping competing explanations available. A pattern may recur across events because a mechanism is shared. It may also recur because of common instrumentation, preprocessing or selection of particularly clear examples. Those possibilities require different tests.
A useful validation plan therefore asks two questions separately. Does the feature remain detectable when the event is hidden from the analyst? And does the proposed mechanism explain observations beyond the feature used to discover it? Success on the first supports predictive value; success on the second supports interpretation. Neither result should be assumed merely because the other looks persuasive.
This separation gives mechanistic research a productive role even when its first predictive test is imperfect. It can identify what additional observation would discriminate between explanations. The next instrument or analysis then has a defined purpose, rather than being added to an ever-growing collection of possible precursors.
Replaying the past is not the same as living through it
David Dempsey and colleagues' 2020 Whakaari study developed machine-learning forecasts from seismic data and evaluated them through cross-validation. The published analysis tested the ability to anticipate withheld eruptions, including the 2019 event. It did not mean that the reported model had issued that advance forecast operationally before the tragedy. The distinction between a retrospective test with a hidden outcome and an actual contemporaneous forecast is essential to the claim. Dempsey and colleagues
Retrospective evaluation is valuable because it permits controlled comparisons and helps identify promising methods. Its danger is not that the past is unusable. Its danger is that information from later in the sequence can enter earlier decisions in ways that are hard to notice once the entire record is available.
An original example concerns normalization. Imagine a researcher rescaling a fictional year-long signal using its largest value across the whole year, then simulating a forecast made in February. The February calculation now depends on a maximum that might occur in November. Even if the eruption label itself was hidden, the preprocessing has used future information. A real February forecast would need a scale available by February.
A second example concerns selection. If an analyst chooses the quiet interval, the station and the smoothing setting only after seeing which combination most clearly anticipates an event, a later replay of that selected pipeline is not a fully independent test of discovery. It may still be a legitimate exploratory result, but the claim should say so.
A stronger replay preserves the information boundary at every stage: data availability, quality control, model fitting, parameter choice and interpretation. The question is not whether a computer can be instructed to hide a final label. It is whether the entire procedure could have existed, with the same decisions, before the outcome.
Operational testing adds further difficulties that a clean archive can miss. A record may arrive late, a sensor may fail or an analyst may have to interpret an ambiguous state before a corrected dataset exists. A good retrospective study can expose many weaknesses. It cannot silently certify every untested feature of continuous use.
Transfer is a test of what the model has learned
In a study published in February 2025, Ardid and colleagues used seismic records from forty-one eruptions at twenty-four volcanoes to investigate transfer learning. Their evaluation withheld data from target volcanoes when testing whether information learned elsewhere remained useful. This is a stronger transfer question than simply withholding a few time windows from a familiar site. The result concerns the studied dataset and evaluation design, not an assurance that any unmonitored volcano can immediately inherit the same performance. Ardid and colleagues, transfer-learning study
There are several levels of novelty that can be hidden in the phrase unseen data. An unseen minute from a familiar eruption is one level. An unseen eruption at a familiar volcano is another. A volcano absent from training is a more substantial change. A future event recorded by a changed network introduces still another set of conditions.
Imagine a fictional archive containing ten thousand short windows from only two eruptive episodes. Randomly placing some windows in training and others in testing can create a very large test set with very little independence at the episode level. Adjacent windows can share both the same physical episode and most of their underlying measurements. The impressive count of rows should not be confused with the count of independent tests.
A different design could hold out an entire episode, preserving the temporal grouping. Another could hold out the entire volcano. These tests answer different questions and can all be useful if named accurately. The strongest headline should correspond to the strongest test actually performed, not to the largest number printed in the dataset description.
Transfer also has a physical boundary. A model may rely on a feature that is measurable with one network but unavailable or distorted with another. A result obtained from a well-recorded archive does not eliminate the need to assess whether the intended application supplies comparable information. Missing sensors are not automatically equivalent to ordinary noisy readings.
The most useful transfer result would help identify which information is portable and which must be learned locally. That can guide a research program toward the observations that matter. It is a more productive aim than treating every difference between volcanoes as either proof that transfer is impossible or an inconvenience to be ignored.
An accelerating curve does not choose its own endpoint
Andrew Bell, Mark Naylor, Michael Heap and Ian Main evaluated the failure forecast method in a 2011 study using synthetic data, laboratory experiments and volcanic observations. They showed that assumptions about the data's error structure could produce biased or imprecise forecasts and examined a generalized-linear-model alternative. The result is not that accelerating precursors contain no information. It is that the method used to fit them and represent uncertainty can materially alter the inferred failure time. Bell and colleagues
Extrapolation becomes most tempting when a curve appears to steepen toward a dramatic endpoint. Yet the endpoint is not directly measured merely because it can be drawn. It depends on the model, the fitting interval and the meaning of deviations from the model. A smooth line can make those dependencies harder to see.
An original elementary illustration uses a declining sequence. Suppose a fictional transformed signal has values of six, four and two at three evenly spaced times. A straight extension reaches zero one interval later. Now suppose the middle observation is five rather than four, or the last observation is uncertain between two and four. The preferred extension and its uncertainty can change. The calculation is an illustration of extrapolation, not an eruption model or a method for timing a real volcano.
The choice of where to begin fitting also matters. A long record may contain several regimes, and a short selected interval may look more regular than the complete history. If the fitting window is chosen because it leads to the known event time, the apparent forecast skill partly reflects hindsight. If it is chosen by a rule fixed in advance, that rule itself becomes testable.
A useful report would show how the forecast changes when plausible analytical choices change, without pretending that every alternative deserves equal credibility. Sensitivity analysis identifies which assumptions carry the result. It can distinguish a stable inference from a precise-looking answer that depends on one favorable window.
The physical interpretation remains important as well. A mathematical singularity is a feature of an idealized model. Whether it corresponds to the onset of a particular observed event is a separate empirical question. Forecasting improves when that correspondence is evaluated, not when the elegance of the curve is allowed to stand in for validation.
A probability tree makes assumptions visible
Warner Marzocchi, Laura Sandri and Jacopo Selva introduced BET_EF in a paper first published online on August 3, 2007, with a March 2008 issue date. The accessible publisher abstract describes a Bayesian event-tree approach combining theoretical, historical, monitoring and prior information. Only that abstract and publication metadata were available here; this article does not claim to reproduce the software's full implementation. Marzocchi, Sandri and Selva
An event tree is useful as a way to make a chain of conditional questions explicit. In a fictional simplified tree, let the probability of continued intrusion during a stated interval be one half. Conditional on continued intrusion, let the probability of a surface outbreak be one fifth. The joint probability along that branch is one tenth, not one half plus one fifth. These invented values are a probability lesson, not a volcanic assessment.
Now change the second conditional probability to four fifths. The joint probability becomes two fifths even though the first branch is unchanged. The example shows why agreement about an early stage does not require agreement about the final outcome. Two analysts can accept the same observation and differ because they interpret a later transition differently.
The tree does not remove disagreement. It gives disagreement an address. Is the uncertainty about whether an intrusion is occurring, whether it will continue, where it could emerge or what type of activity could follow? Putting those questions in separate places makes it easier to identify which new observation would be most informative.
It also discourages a misleading mixture of conditional and unconditional statements. “If an eruption occurs, this sector is favored” is not equivalent to “an eruption in this sector is likely.” The first statement may coexist with a low overall eruption probability. A map or headline that drops the condition can transform a cautious spatial statement into an exaggerated overall claim.
A complete forecast description should preserve branches that do not end in the most dramatic event. Otherwise the diagram becomes a narrative funnel: once unrest is admitted, every path seems to lead to eruption. The possibility of stabilization or a different outcome belongs in the reasoning, even when it produces a less visually satisfying story.
A new vent is a different spatial problem
Alec Wild, Mark Bebbington and Jan Lindsay's May 24, 2022 study adapted a Bayesian event tree for the Auckland Volcanic Field and tested it on eight hypothetical eruption scenarios. It examined how prior spatial information and monitoring inputs influenced results, identifying problems with carrying some default assumptions into a distributed volcanic setting. These were scenario-based tests, not eight observed successful forecasts of real Auckland eruptions. Wild and colleagues
The important distinction is between learning about activity at an established center and inferring where activity may emerge within a wider field. A method that assumes a known source location can answer a different question from one that must infer the location itself. Transferring a model between those settings requires more than changing the name on the map.
For an invented spatial example, divide an area into four equally sized sectors. Before new observations, assign each a quarter of the conditional probability of vent location. Suppose the new evidence supports one sector more strongly. A model must specify how that evidence modifies the earlier distribution. Simply displaying the old distribution and the new signal together does not define the update.
Equal area is not equal plausibility, and a large colored region is not automatically a large probability. A map can show probability density per unit area, total probability assigned to a region or a thresholded category. Those are different quantities. If the legend does not identify which one is plotted, visual comparisons can be misleading even when the underlying calculation is correct.
Resolution adds another complication. Dividing the favored sector into smaller cells changes the probability assigned to each cell without necessarily changing the probability of the sector as a whole. A darker or lighter pixel can therefore reflect a change in representation rather than a change in the scientific assessment.
The useful output is not merely a beautiful surface of colors. It is a spatial statement with an event definition, a time condition and an explanation of how observations and assumptions shaped it. This article supplies no actual forecast map because invented geography would make the distinction harder, not easier, to understand.
Some sequences challenge the usual story
Delphine Smittarello and colleagues' 2022 Nyiragongo study described the May 22, 2021 flank eruption as occurring without apparent precursors and with lateral magma movement following, rather than preceding, its onset. The authors proposed edifice rupture as the likely initiating mechanism. This account is limited here to the original abstract available through PubMed; the publisher route failed and an author-hosted PDF exceeded the browsing tool's size limit. “Without apparent precursors” is not a claim that every physically possible measurement was made or that no future method could find useful information. Smittarello and colleagues
The case illustrates why a forecasting model needs a domain of applicability. If a model expects one sequence of physical stages, a different initiating mechanism may not produce the expected advance signals. Adding more confidence to the old sequence does not solve that mismatch. The model must be confronted with cases that challenge its structure.
There are several distinct explanations for not observing a precursor. A relevant process may not have occurred. It may have occurred outside the monitored region. Its signal may have been below a detection threshold, obscured by other activity or too brief for the available observation. An analysis should not choose among these explanations solely because one makes the existing method look better.
A fictional missing-data example helps. If an instrument records nothing during a power failure, the record says that the observation is missing. It does not say the ground was still. If an operating instrument records no change larger than a stated detection limit, that is a different and more informative statement. Both can appear as a flat or empty region in a badly designed plot.
The honest boundary is therefore observational. State what was monitored, during which intervals, with what usable sensitivity, then state what was or was not detected. This protects the value of a negative result. It can reveal a genuine limit of a proposed precursor without claiming omniscient access to the volcano.
A forecast system that records where it cannot see is more scientifically useful than one that converts every silence into reassurance. The absence of a detected signal is evidence with conditions, not an unconditional promise about what happens next.
A collapse forecast is not an eruption-onset forecast
Ian McBrearty and Paul Segall's author manuscript, revised May 3, 2024, investigated recurrent caldera-collapse events during Kīlauea's 2018 eruption. The study used a graph neural network and local monitoring data to estimate time to those events, comparing its predictions with a recurrence-based alternative. The full author HTML was inspected. Its target is a sequence of collapses during an eruption, not a demonstration that the same model predicts the onset of unrelated eruptions worldwide. McBrearty and Segall
This is a useful example of how a carefully bounded task can be scientifically ambitious without supporting an unlimited headline. Repeated events can provide opportunities to test a model that a rarely erupting volcano cannot readily supply. But the recurrence structure is part of the problem, not a free advantage that automatically transfers elsewhere.
Imagine a fictional sequence in which an event repeatedly occurs after roughly comparable intervals. A model using detailed sensor data should be compared with a simple baseline that uses those intervals. Beating a constant guess is not enough if the recurrence pattern already provides substantial information. The relevant question is what the new data add beyond the knowledge available without them.
Now imagine that the intervals gradually change. A baseline fixed at the beginning may become less competitive, while an adaptive baseline could remain informative. Evaluation should therefore distinguish improvement over a weak comparator from improvement over a reasonable alternative available at the time. The word sophisticated describes a model's machinery, not the strength of its comparison.
A useful test also asks when the information becomes available. A prediction made shortly before an event may be accurate while offering little advance separation from the event itself. A prediction made earlier may be less sharp but answer a different scientific or practical question. Lead time and error belong together.
The resulting research program is richer than a contest to predict the final minute. It can ask how understanding improves as each part of a cycle unfolds, which observations contribute most and when the remaining uncertainty stops being dominated by measurement. Those are meaningful results even when the correct conclusion remains specific to the studied sequence.
A forecast needs a record that predates the outcome
The Axial Seamount Eruption Forecasting Experiment, described in an author preprint first submitted in November 2025 and inspected here in its September 8, 2026 version, proposes timestamped, cryptographically committed forecast documents with later disclosure. The version includes a record of commitments and describes an evolving research framework. This is evidence of an explicit prospective-testing design, not proof that its forecasts have succeeded or a statement about Axial's current eruptive status. Lei and colleagues, version 10
A preserved forecast separates a prior claim from a later reconstruction.
For an original reporting proposal, the preserved object would contain the target definition, issue time, information cutoff, model version and forecast itself. A later correction would create a new version rather than overwrite the old one. The history would show which changes were made before the event and which were made afterward.
Matching hashes support document integrity, not scientific validity or practical usefulness.
Disclosure rules matter too. If only successful forecasts are eventually shown, the archive cannot reveal the method's complete performance. If failures are available but difficult to locate, a summary may still create a distorted impression. The relevant collection includes the attempts that were wrong, ambiguous, withdrawn or not issued because required data were unavailable.
That last category deserves a name. A model that abstains when information is poor can be more honest than one that always returns a number. Its performance should nevertheless report the fraction of relevant time or events for which it supplied a usable forecast. Skill during favorable operation and coverage across the complete task are different properties.
Uncertainty about the model is not the same as variability within it
Marzocchi, Selva and Thomas Jordan's November 18, 2021 paper develops a probabilistic framework that distinguishes variability in volcanic behavior, incomplete knowledge and the possibility that a model omits relevant behavior. It emphasizes testability rather than treating a calculated probability as self-validating. This is a methodological research contribution, not a measurement showing that uncertainty at a particular volcano has been eliminated. Marzocchi, Selva and Jordan
A fictional model can illustrate the difference. Suppose it allows only two outcomes and assigns probabilities to them. It can represent uncertainty about which of those two occurs. If the real system has a third important outcome absent from the model, recalculating the first two probabilities more precisely does not make the model complete.
This is one reason a narrow numerical interval can be misleading. The interval may describe uncertainty conditional on assumptions that are themselves doubtful. A report should identify those assumptions instead of allowing the precision of the calculation to conceal uncertainty about the setup.
Disagreement among credible models can be informative. It may arise from different interpretations of the same observation, different physical mechanisms or different treatment of missing data. Averaging their outputs can be useful for some purposes, but an average alone does not explain the disagreement. The research question is often which observation would cause the models to diverge less.
A practical scientific discussion can preserve a short list of competing scenarios with the evidence favoring and challenging each. This need not become an unranked catalogue of every imaginable event. It should focus on alternatives that are physically meaningful and relevant to the stated forecast target.
The purpose is to make revision possible without rewriting history. If a new observation supports a previously weaker scenario, the earlier record explains why it was weaker and what changed. That is stronger evidence of learning than an account in which the favored explanation always appears to have been obvious.
The denominator can reverse the impression
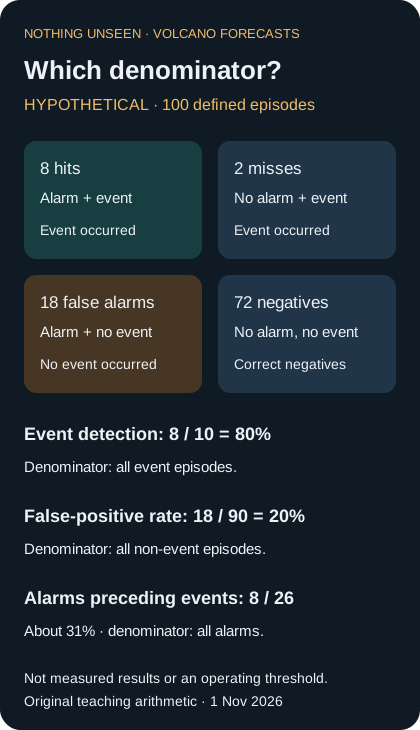
Fictional evaluation, not observed volcano performance. Each episode belongs to one of four cells. Event detection, false-positive rate and the fraction of alarms preceding events have different denominators.
Forecast evaluation needs more than a count of events preceded by alarms. An original fictional example makes the issue concrete. Across one hundred predefined episodes, suppose ten end in the target event and ninety do not. A method alarms before eight events, misses two, and also alarms in eighteen non-event episodes. It detects eight of ten events, or eighty percent. Among its twenty-six alarms, however, only eight precede the target, about thirty-one percent.
The false-positive rate in this example is eighteen out of ninety, or twenty percent. It is not eighteen out of twenty-six. That latter fraction answers a different question: what share of alarms are false? Both questions can matter, but labeling them with the same loose phrase false-alarm rate invites confusion. None of these invented values describes an actual volcano or a recommended operating threshold.
Time adds another denominator. A system that spends ninety percent of its operating history in an alarm state may precede many eruptions while identifying little exceptional time. A system with very short alarms may cover less time but miss events whose precursors evolve differently. A complete evaluation should reveal the temporal definition rather than allowing the chosen episode boundaries to hide it.
Overlapping forecasts also need care. If a model updates hourly for an event that occurs once, the archive may contain many related successful forecasts. They are not many independent eruptions. Reporting both the number of issued forecasts and the number of distinct target events prevents the update frequency from inflating the apparent evidence base.
The same discipline applies to equipment availability. A score calculated only while a station was functioning answers a legitimate conditional question. It should remain visibly conditional. If difficult weather or intense activity also makes observations unavailable, excluding those intervals can leave the evaluated subset different from the full intended task.
No single score can preserve every distinction. A useful evaluation gives a small set of compatible quantities with their denominators, target definitions and exclusions. The point is not to bury a reader in statistics. It is to prevent one impressive number from doing the work of several unanswered questions.
Forecast skill and decision value remain separate
Ardid, Dempsey, Garry McDonald and Cronin published a potential-economic-value analysis online on August 26, 2026, with a September 1 version of record. It examined forecast-based decisions through retrospective case studies and modeled consequences. Its counterfactual benefits are not observed reductions in losses from an implemented policy. This distinction matters even when the modeling supplies a useful way to compare the consequences of missed events and false alarms. Ardid and colleagues, 2026
The scientific forecast and the decision made with it are related but different objects. A probability can remain unchanged while different people face different consequences from acting or waiting. Conversely, improving a forecast does not automatically specify the right action if the decision's costs, constraints and authority are unresolved.
An original abstract decision example uses no real lives or money. Suppose acting has a cost of three teaching units, and not acting incurs a loss of twenty units if a defined event occurs. In a deliberately simplified model where action completely prevents that loss and has no other consequences, the break-even event probability is three divided by twenty, or fifteen percent. Change the assumptions and the threshold changes. This is arithmetic for understanding dependence on assumptions, not guidance for an actual volcanic crisis.
Real decisions cannot be compressed into that toy without confronting what it excludes. The action may not eliminate harm, different groups may bear different burdens, repeated actions may have cumulative effects, and some consequences may not be meaningfully represented by one scalar cost. The forecast scientist does not gain authority to settle those matters merely by producing a probability.
The useful contribution of decision analysis is to expose dependencies, not to disguise value judgments as inevitable mathematics. It can show why a method with more false alarms might still be useful under some conditions, or why a technically accurate forecast might not change a particular decision. The analysis remains conditional on its inputs and on the legitimacy of the decision process.
Progress looks like a better question with a preserved answer
The studies assembled here do not add up to a single universal eruption predictor. They address different physical processes, different targets and different forms of validation. Their value becomes clearer when those distinctions remain visible rather than being flattened into a competition among headline percentages.
For a new result, the first question is what changed underground according to the evidence. The next is what future event the method is actually asked to forecast. Then come the information cutoff, the independent test, the coverage of difficult intervals and the consequences of the assumptions that remain uncertain. These questions let a reader recognize progress without assuming certainty.
A particularly useful advance may be a new physical interpretation, a stronger ground-truth record, an evaluation on a genuinely different volcano or a prospective test that preserves failures. It need not be a promise that every eruption can be scheduled. Making one transition in the chain more intelligible can be a substantial scientific achievement.
The record should also leave room for a volcano to change course. An intrusion that stalls, a system that follows an unfamiliar sequence and an event that lacks the expected detectable signal are not inconveniences to remove from the archive. They are observations that define what a forecast has learned and what it still cannot reliably distinguish.
A credible forecast is therefore more than a date or probability. It is a dated claim with a target, evidence, assumptions and a way to be proved inadequate. The strongest forecasting science does not ask a volcano to keep an appointment. It makes the changing limits of the appointment book explicit.
Evidence and access note
Prepared and accessed 1 November 2026. Fourteen distinct primary research/institutional works cited; observational evaluations, retrospective models, scenario experiments, methodological proposals and an operational bulletin are identified separately. BET_EF and Nyiragongo use accessible original abstracts only. No present-day volcano safety status, official forecast or emergency instruction is supplied. All teaching numbers, balances, maps described in words and decision examples are explicitly invented; source details and access failures are retained in the separate ledger.