
In September 2025, the US National Institute of Standards and Technology described a newly published method for testing unwanted by-products from air cleaners. The method addresses ozone, formaldehyde and ultrafine particles. That development captures a basic challenge in indoor-air evaluation: demonstrating that a device removes something does not finish the job. Its other effects, the conditions of the test and its performance in an occupied room still matter. NIST announcement, 2 September 2025.
Picture a hypothetical classroom with a portable filter near the door, an air-quality display on a shelf and a ventilation system serving several rooms. The display turns green. A teacher lowers the fan because it is difficult to hear. Someone opens a window. At the end of the day, a graph shows a low average particle concentration. Each observation is real within the imagined example, but none alone establishes the air conditions during the busiest lesson.
The problem is not a lack of possible measurements. It is choosing measurements that answer the question being asked. Filter efficiency describes capture under specified conditions. Clean-air delivery combines removal with airflow. A carbon dioxide reading can help investigate outdoor-air ventilation in context. A particle monitor estimates a different property of the air. Evidence about illness requires another layer of study altogether.
A useful indoor-air investigation joins those layers without collapsing them. It asks what pollutant or exposure is of concern, how it enters the space, what removes it, where people are and when the controls actually operate. The resulting picture is more demanding than a device label, but also more useful. It can reveal an improvement that a single sensor misses, or expose an apparent improvement caused by an empty room.
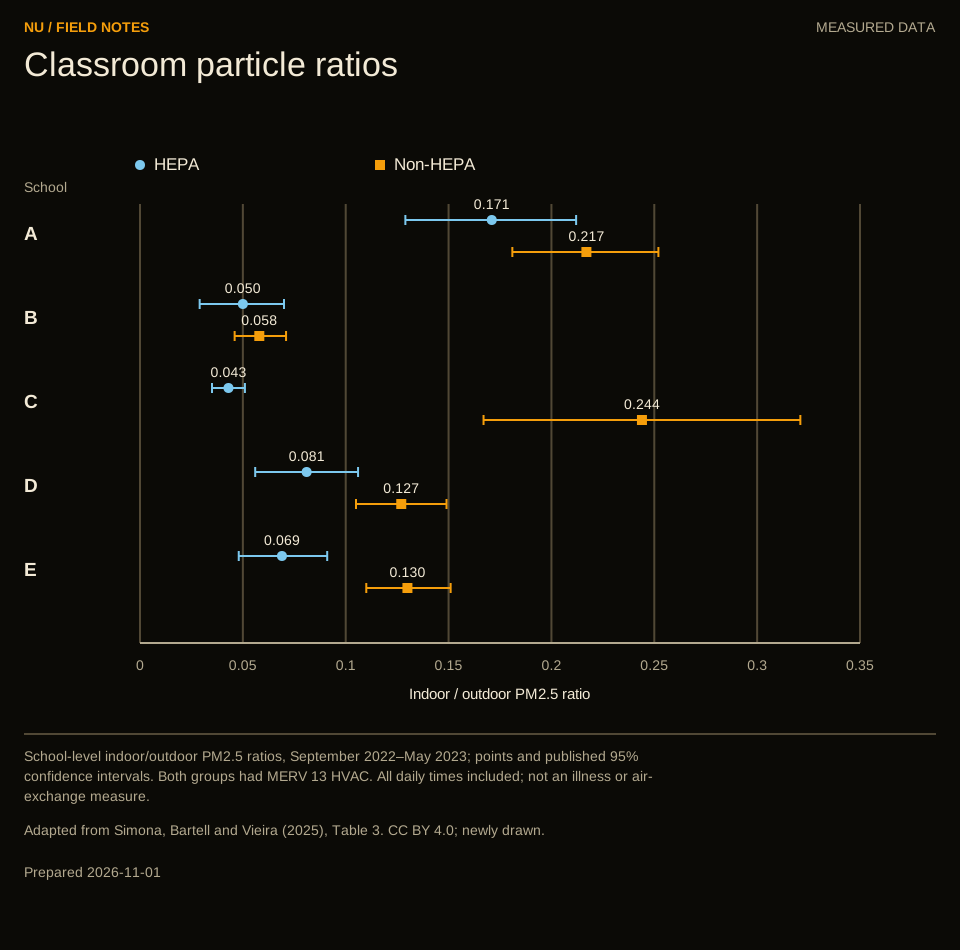
School-level indoor/outdoor PM2.5 ratios, September 2022–May 2023; points and published 95% confidence intervals. Both groups had MERV 13 HVAC. All daily times included; not an illness or air-exchange measure.
Begin with the question, then choose the instrument
There are several legitimate reasons to measure indoor air. A facilities team may want to know whether outdoor air reaches a crowded room. A researcher may want to quantify particle removal. A building occupant may want to identify the timing of an indoor source. A trial may ask whether an intervention changes a health outcome. These tasks overlap, but they require different evidence.
For example, a particle reading cannot identify all the gases in a room. A carbon dioxide reading cannot establish the concentration of every kind of aerosol. An instrument measuring total particle number cannot tell whether those particles contain infectious material. The correct interpretation begins with the quantity the instrument actually measures, including its size range, averaging period and measurement principle.
EPA's current consumer guidance stresses that low-cost monitors detect only their specified pollutants or environmental factors. It also distinguishes their alerts from certified smoke and carbon monoxide alarms intended to warn of immediate danger. Those are different functions, even when the devices share a display or an audible signal. EPA guidance on low-cost indoor monitors.
A well-formed question therefore names an endpoint. Instead of asking whether a room has good air, one might ask whether the measured particle concentration changes when an existing filtration system operates under comparable conditions. Instead of asking whether a green light proves safety, one might ask which variable drives the light and what the manufacturer means by its threshold.
This discipline prevents an instrument from acquiring authority beyond its design. It also makes limitations manageable. A sensor can be useful for tracking a recurring event without being sufficiently accurate to establish a small absolute difference between rooms. Knowing that boundary allows the measurement to contribute rather than forcing it to answer every question at once.
Follow the paths through the room
A conceptual room balance has inputs, internal sources, outputs and removal processes. Outdoor air can enter through a mechanical system or an opening. Air can move between rooms. Particles may be captured by filters or deposited on surfaces. Indoor activities can add pollutants. The concentration reflects these processes together, not the performance of one device in isolation.
The direction of change depends on the pollutant. Introducing outdoor air can dilute an indoor-generated gas while also bringing in outdoor particles. Recirculating room air through a particle filter can reduce particles without removing the carbon dioxide generated by occupants. This is why the phrase more air needs a qualifier: more outdoor air, more recirculated air and more effectively cleaned air are different quantities.
The CDC's ventilation overview, updated on 28 October 2026, includes outdoor-air delivery, filtration and other air treatment within a broad ventilation discussion. It explicitly distinguishes equivalent ventilation from minimum outdoor-air requirements. The page's update date is not evidence that a new requirement was created that day. CDC ventilation overview and page-history notes.
For the hypothetical classroom, the initial sketch should show the supply, return, exhaust, openings and portable cleaner. It should identify which routes connect to other spaces. A supply grille alone does not reveal how much of the delivered air originated outdoors. Likewise, the presence of a return grille does not establish that all parts of the occupied zone are equally served.
The sketch is a starting hypothesis. Measurements and system information are needed to establish actual flows. Its value is that it makes missing knowledge visible. If the clean-air claim depends on a particular route, that route becomes something to verify rather than a background assumption hidden behind the word ventilation.
Efficiency needs airflow beside it
A filter can capture a high fraction of particles passing through it while handling little air. Another arrangement can process more air with a lower capture fraction. For a simplified single-pass particle calculation, multiplying airflow by removal efficiency gives an equivalent clean-air flow. This relationship is useful only when its conditions and pollutant basis are understood.
Take two invented devices. One moves 200 cubic metres per hour and removes 95 percent of the relevant particles in a pass. Its simplified clean-air quantity is 190 cubic metres per hour. Another moves 400 cubic metres per hour and removes 60 percent, giving 240 cubic metres per hour. These examples are arithmetic, not product recommendations. They show why ranking devices by efficiency alone can give the wrong answer to a room-level question.
EPA's air-cleaner guide explains clean air delivery rate, or CADR, as a particle-performance measure and notes that ratings are typically obtained at the highest fan setting. Gas removal is a separate capability. The guide also emphasises compatibility when changing central-system filters. EPA Guide to Air Cleaners in the Home.
A labelled CADR still needs an operating context. Which particle challenge was used? At which setting was the device tested? Will it operate at that setting during occupancy? Does the intended room include adjoining areas that remain open? These questions connect a laboratory result to a use case without dismissing the value of standardised testing.
The same calculation should not count a single airflow twice. If a reported clean-air quantity already incorporates filtration efficiency, multiplying it by that efficiency again would reduce it incorrectly. If a reported total flow includes outdoor air and recirculated air, treating the entire flow as outdoor ventilation would overstate one pathway. Keeping the quantities named prevents these elementary but consequential mistakes.
A filter is more complicated than a sieve
A common mental model imagines a filter as a screen with holes: particles smaller than the holes pass through, and larger ones stop. Fibrous filtration does not follow that simple cutoff. Particle motion and interaction with fibres matter, so a nominal particle size in a performance definition should not be read as the smallest size that can be captured.
EPA's HEPA explanation identifies 0.3 micrometres as the reference size in its familiar efficiency description and notes that smaller and larger particles can be captured more efficiently. The figure describes a performance condition, rather than an opening size through which every smaller particle passes. EPA explanation of HEPA filtration.
For an installed system, the question also includes whether air goes through the filter as intended. A rating for the filter medium cannot by itself describe leakage around an installation, a damaged element or an arrangement used outside its intended conditions. The relevant object is the assembled air path in operation, not only the material shown on a product sheet.
MERV provides another rating framework, using capture performance across specified particle-size ranges. EPA describes its role in comparing central-system filters and warns that the system must accommodate the selected filter. A higher rating is consequently only one part of an installation decision. EPA explanation of MERV ratings.
An editorial comparison should keep these categories separate. HEPA terminology, a MERV rating and a whole-device CADR do not express the same measurement. A useful report identifies which component or assembly was tested, the test conditions and the quantity being reported. It avoids translating every label into a single percentage called protection, which would erase the very distinctions needed to understand the result.
The room volume changes the denominator
Dividing a clean-air flow by room volume produces an equivalent air-change rate for the relevant removal process. The units simplify to inverse time. It is a convenient way to compare a flow with the size of the space, but it does not mean that each litre of original air is replaced exactly once during a corresponding interval.
Suppose a fictional room measures ten metres by six metres by three metres. Its volume is 180 cubic metres. A clean-air flow of 540 cubic metres per hour corresponds to three equivalent air changes per hour. A room with twice the volume would have half that rate from the same clean-air flow. These are geometry and division, not a recommended target for a particular building.
The interpretation also depends on mixing and sources. In an idealised well-mixed room with no continuing source and a constant first-order removal rate, concentration declines exponentially. One nominal air change leaves about 37 percent of the initial excess concentration, rather than eliminating it completely. That is a property of the idealised model, not a guarantee of what every location in a real room will experience.
Room area alone can therefore conceal an important difference. Two spaces with the same floor area but different ceiling heights have different volumes. Open connections to adjoining rooms complicate the boundary further. A device's area claim is meaningful only with the assumptions used to produce it.
There is another denominator worth retaining: occupants. A room-volume measure does not describe how many people share the space or what they are doing. Neither denominator replaces the other. Volume is part of the concentration dynamics, while occupancy and activity affect some source terms. A useful account records both instead of assuming that one room-size number captures the whole exposure setting.
A decay curve can answer the wrong question perfectly
The exponential model is powerful because it turns a changing concentration into an interpretable rate. If a source has stopped and background conditions are stable, the decline can reveal how quickly material is being removed. The complication is that a classroom, office or home often has sources that continue or change during the measurement.
For an original model illustration, let an excess concentration decline at three per hour. After twenty minutes, one third of an hour, the remaining fraction is approximately 0.37. After forty minutes it is approximately 0.14. These are calculated fractions for an idealised source-free case. They are not predictions of infection risk or performance measurements for a real cleaner.
Now introduce a continuing source. Concentration can approach a nonzero level because addition and removal balance. A device can be working effectively even though the reading never reaches the outdoor background. Conversely, a rapid decline after people leave may partly reflect the disappearance of a source rather than a change in cleaning performance.
Li and colleagues' 2025 test-house study examines this distinction between pulse-introduced particles and continuing infiltration, including differences between locations. The accessible NIST record provides the complete abstract; the linked manuscript download was not readable by the web tool. Only that abstract's bounded description is used here. NIST record of the primary study.
This distinction suggests two different questions for evidence. How quickly does a system remove a defined disturbance after it ends? And what concentration results while a source continues under specified conditions? A strong result for the first question can inform the second, but it cannot replace the missing source and transport information. The measurement is useful when the question matches the experiment.
The occupied zone is not a single point
A measurement at one location is a measurement at one location. It may represent a larger space well, or it may be strongly influenced by a nearby source, inlet or cleaner. Deciding which is true requires more than confidence in the sensor's electronics. It requires attention to airflow and the purpose of the measurement.
EPA's sensor-siting guidance recommends representative indoor locations with unobstructed air access and cautions against placement immediately beside sources or sinks when the goal is a room-level picture. It also explains that outdoor calibration relationships may not transfer to indoor conditions. EPA guide to sensor siting and installation.
Return to the imagined classroom. A sensor directly in the cleaner's discharge may report a lower concentration than one near the far side of the occupied space. That difference would not necessarily indicate that either instrument is faulty. It could reveal that they are sampling different air. Conversely, two instruments beside one another can agree closely while both miss an unmeasured part of the room.
The investigation should distinguish instrument agreement from spatial representativeness. Bringing devices together can help identify relative offsets. Separating them can explore spatial variation. Those are different phases with different purposes. A report that records only the final values loses the logic of the comparison.
Location also changes over time. Furniture moves, a door is held open, a partition is installed or the device is relocated to reach an outlet. A measurement record should preserve those changes. A graph whose labels say only Room A and Room B may appear stable while the sampling arrangement has changed underneath it. The physical story belongs with the numerical one.
Carbon dioxide supplies context, not a universal verdict
People generate carbon dioxide, so its concentration can help investigate the relationship between occupancy and outdoor-air delivery. But interpreting that relationship requires information about the people, the space, the outdoor background and the time since occupancy changed. A universal colour threshold cannot supply all those missing variables.
NIST Technical Note 2213, published in March 2022, develops a space-specific carbon dioxide metric using occupancy, generation and ventilation assumptions. It explicitly challenges the use of one concentration as a universal indicator of indoor-air quality. The report's model and user guide make the assumptions visible. Persily and Polidoro, Indoor Carbon Dioxide Metric Analysis Tool.
A simple hypothetical comparison shows why context matters. Two rooms with the same measured carbon dioxide can have different numbers of occupants and different outdoor-air flows. A room measured shortly after people arrive may not have reached the concentration associated with sustained occupancy. A room measured after departure may still reflect earlier conditions. The reading is part of a time-dependent balance.
Particle filtration introduces an especially important distinction. A mechanical particle filter does not provide the same carbon dioxide removal pathway as outdoor-air exchange. A carbon dioxide reading can remain elevated while particle removal improves. Using that unchanged reading to declare the filter ineffective would test the wrong outcome. Using a low reading to declare all airborne hazards absent would make the opposite mistake.
The practical value of carbon dioxide monitoring is therefore investigative. It can identify patterns worth examining and help compare a space with its expected behaviour under stated conditions. It should be accompanied by occupancy and system information. A graph becomes much more informative when arrivals, departures and operating changes are marked rather than left for the reader to infer from the curve.
Infection claims require another bridge
A carbon dioxide instrument does not establish whether an infectious person is present, how much infectious material is emitted or whether nearby exposure differs from a room average. CDC's ventilation FAQ makes these limitations explicit and also discusses how placement and airflow affect readings. CDC ventilation FAQ, carbon dioxide section.
More generally, particle concentration, biological material, viability, inhaled dose and illness are different endpoints. A test can establish a change at one point in that chain without directly observing the others. That does not make the test worthless. It establishes the scope of what was demonstrated and identifies what additional evidence would be needed for a broader claim.
For example, a particle-removal experiment may be highly informative about an air cleaner's physical performance. It still does not identify the composition of every particle removed. A molecular assay can detect biological material without establishing that all detected material remains capable of transmission. A health-outcome study introduces additional variables, including exposures outside the measured room.
An account that keeps those endpoints separate can avoid two misleading extremes. It need not demand an illness trial before acknowledging a physical removal result. It also need not convert that removal result directly into a percentage reduction in illness. The evidential bridge has to be argued and tested rather than supplied by the word protection.
This article concerns measurement and interpretation, not individual medical decisions. Building-specific ventilation changes and specialised infection-control measures require appropriately qualified assessment. The purpose of the distinctions is to make claims more precise: which endpoint changed, under which conditions, and how far does the evidence support extending that result?
Particle number and particle mass tell different stories
A collection of many very small particles can dominate a number count without dominating mass. A smaller number of larger particles can contribute substantially to mass. Instruments reporting these quantities can therefore show different patterns even while sampling the same air. The apparent disagreement may begin with the definition of the measurement.
For equal-density spheres, mass scales with the cube of diameter. In a purely geometrical example, a particle ten times larger in diameter has one thousand times the mass. Real aerosols have varying shapes, densities and optical properties, but the example explains why counting particles and estimating their mass are not interchangeable tasks.
Optical instruments add another layer. They infer information from scattered light, then use assumptions or calibration relationships to report a quantity such as estimated mass concentration. A sensor's response can depend on the aerosol encountered. A display with several decimal places does not remove those dependencies.
Wang, Delp and Singer's 2020 study evaluated low-cost monitors against residential particle sources. The tested devices' responses varied with the aerosol, and particles below their effective optical detection range could produce little response. The study concerns the tested devices and conditions; it should not be treated as a ranking of every current monitor. Primary accepted manuscript.
The implication for an intervention study is to retain the measurement definition across comparisons. If the aerosol changes after an activity or a ventilation adjustment, a change in sensor response may not map perfectly onto the change in true mass. Where small differences matter, the measurement method needs enough validation to support them. Trend detection and quantitative exposure estimation can demand different levels of evidence.
Averages should follow the people
An average is a choice about which times count. A daily mean weights an empty night alongside an occupied afternoon unless the analysis says otherwise. An occupied-hour mean asks a different question. A peak value captures another aspect of the record. Each can be useful, but they should not be presented as if they described the same exposure.
Imagine a fictional room with a low concentration for eighteen unoccupied hours and a higher concentration for six occupied hours. The daily average could look reassuring while giving limited information about the period when people are present. Conversely, a brief isolated spike could dominate a maximum without representing most of the day. Reporting the time basis resolves much of this ambiguity.
Time weighting becomes more complicated when occupancy varies. Twenty people present for one hour and two people present for another hour contribute equally to a simple room-time average, but not to a person-time description. That does not mean every study must collect individual location histories. It means the chosen summary should be matched to its stated purpose.
Missing data also need a place in the account. If a monitor loses power during the busiest activity, the remaining record is not automatically representative. A system that stores only hourly averages may conceal a short event relevant to the question. Data completeness and resolution are part of the result, not merely technical details for an appendix.
A practical graph can show concentration alongside occupancy periods and device operation without identifying individual occupants. Such a presentation preserves privacy while making the average interpretable. It also helps distinguish a genuine change in room conditions from a change in when measurements happened to be available.
What a classroom trial can establish
Simona and colleagues' January 2025 randomised classroom study supplies the measured concentration ratios in the accompanying chart. Its caption identifies the conditions and time basis. Primary study, Table 3.
Those design details matter to interpretation. A measured difference between treatment groups is evidence within the intervention and setting studied. It does not supply an automatic prediction for a different room, a different device setting or a different outdoor-pollution pattern. Nor does a particle-concentration comparison by itself measure a change in illness.
In general, dividing one concentration by another gives a dimensionless ratio. It is not an air-change rate, which has inverse-time units. Treating the ratio as ventilation would confuse concentration with flow. Indoor sources and removal processes can affect the ratio as well, so it should be read as the defined concentration comparison rather than a direct measurement of one transport mechanism.
Confidence intervals also deserve their stated meaning. They describe statistical uncertainty in the estimated quantity under the study's analysis. They are not the full range of instantaneous concentrations, a guarantee for another building or a physical limit on the device. A visual should preserve these distinctions in its axis and caption rather than leave readers to infer them.
The broader value of a randomised field comparison is that it tests an intervention amid ordinary building conditions. Its strength comes from design and measurement, not from pretending those conditions disappear. The most useful reading asks what was randomised, what was observed, what happened during operation and which endpoint the resulting comparison actually supports.
A different trial can answer a different question
Sun and colleagues' October 2025 secondary analysis of a school trial examined viral material in air samples. It did not find a statistically significant reduction in its high-viral-exposure endpoint with HEPA purifiers, while reporting a decrease in viral diversity. The authors disclose that the parent trial was powered for a different clinical endpoint, device use was not continuously monitored and their measurements could not establish transmissibility. Primary JAMA Network Open analysis.
That result should be neither concealed nor expanded beyond its design. It does not erase physical evidence that filters capture particles. It also prevents a simple assumption that every field deployment will produce an easily measurable improvement in every biological endpoint. The intervention, operating conditions, sampling strategy and statistical precision all affect what can be concluded.
A nonsignificant result requires particular care. It can reflect a small effect, insufficient precision or several other features of a study; it does not automatically establish exact equivalence. The confidence interval and the endpoint definition matter more than a binary declaration that filtration worked or failed. Conversely, finding a difference in one endpoint does not validate all related claims.
This is why a useful evidence summary separates laboratory performance, occupied-building concentrations, biological sampling and health outcomes. Those categories can reinforce one another, but they are not duplicates. A gap between them is a research question, not permission to fill in an appealing result.
For public communication, the discipline is to describe the observation before the implication. A reader should be able to identify what was measured and what remains an inference. That approach leaves room for strong practical reasons to improve indoor air while avoiding invented certainty about the size of a particular health benefit.
Operation is part of performance
A device that performs well at its maximum setting contributes less clean air if it is operated at a lower setting or switched off. This is not an obscure failure mode. It follows directly from the difference between tested capability and delivered service. An indoor-air evaluation needs information about the operating schedule alongside the specification.
Noise, drafts, space, access to power and interference with activities can affect use. In the hypothetical classroom, lowering a fan to hear speech changes the intervention even though the device remains visibly present. Recording only whether a purifier was installed would miss that change. An evaluation concerned with delivered performance should identify the setting and the periods of operation.
The same applies to central systems. A filter can act on airflow only when air passes through its path. The fraction of time a fan operates, the distribution of air between zones and the state of controls matter to the cumulative service delivered. Equipment inventory is therefore an incomplete proxy for performance over a day.
Maintenance changes the evidence over longer periods. Replacing a filter, altering a setting or moving a device creates a new condition worth recording. The goal is not to assume a universal deterioration rate. It is to avoid treating an initial commissioning result as an indefinitely valid description of a changing installation.
A useful report can make this operational dimension visible without collecting intrusive information. Device runtime, settings, maintenance dates and room-use schedules are often more relevant than personal identity. They help distinguish an intervention that was technically capable but inconsistently delivered from one that was delivered as intended yet produced a limited measured effect. Those situations suggest different next questions.
Source control changes the balance upstream
Removing a source before pollutants spread through the room can alter the problem more directly than treating the resulting mixed air. A local exhaust route, a change in an emitting activity or correction of a building defect belongs in the same investigation as filtration. The right combination depends on what is generating the concern.
EPA's air-cleaner guide places filtration alongside source control and clean outdoor-air ventilation, and explains that an air cleaner does not resolve the moisture source behind a mould problem. That is a reminder to investigate the cause as well as the airborne consequence. EPA air-cleaner guide.
Consider an original, simplified thought experiment. If a source adds material at a constant rate and removal stays constant, reducing the source reduces the amount the removal system must handle. Improving removal can also lower concentration. The two interventions act on different terms in the same balance, so they need not be treated as competing philosophies.
Source control also changes how a before-and-after study should be read. If an emitting activity stops at the same time a cleaner is introduced, the observed reduction cannot be assigned entirely to the cleaner without additional evidence. If the activity becomes more intense, an effective cleaner might appear to have achieved little because the source increased. Recording activities helps interpret both cases.
This is one reason a room investigation benefits from conversation with its occupants. People may know when an unusual event occurred, when a door remained open or why equipment was switched off. Their observations do not replace measurements, but they can identify variables the data logger cannot see. Combining the two produces a more plausible explanation than treating every bend in a graph as a device effect.
Equivalent clean air still needs a defined purpose
ASHRAE's July 2023 announcement of Standard 241 describes an equivalent-clean-air approach and an infection-risk management mode, together with planning and commissioning. This article relies on that public description, not an unread full standard, and does not claim to determine compliance for a building. ASHRAE publication announcement.
The underlying accounting idea is useful: different control pathways can contribute to reducing a specified airborne contaminant. But equivalence is tied to the endpoint being considered. A particle filter and outdoor-air supply can produce similar effects on one particle balance while behaving differently for gases. A treatment that inactivates a biological agent can alter viability without necessarily removing the particle carrying it.
This means an equivalent-clean-air total should identify what is being added together and why. It should avoid mixing incompatible units, different operating schedules or claims derived under unrelated conditions. A nominal system total can conceal whether the relevant service reaches the occupied zone when needed.
There is also a distinction between a design calculation and verification. A calculation describes what should occur if its inputs and assumptions hold. Commissioning investigates whether the installed system behaves as intended. Ongoing checks determine whether that condition persists. These stages complement each other; none makes the others redundant.
For readers evaluating a building claim, the useful question is which stage the evidence represents. A design target can be an important commitment without being a completed measurement. A successful test can establish performance under its conditions without proving year-round operation. The clearest account keeps the target, test and operating record side by side.
A measurement plan should survive an inconvenient result
A credible investigation decides in advance what would count as improvement and what comparisons are needed. Otherwise, a long sensor record offers many opportunities to choose a flattering interval, an especially clean location or an average that hides a difficult period. The problem can arise without deliberate deception: the most attractive graph is not always the most representative one.
For a hypothetical office evaluation, the plan might distinguish a baseline period from a changed operating period, record occupancy and outdoor conditions, preserve device settings and identify the primary measured endpoint. The exact design would require qualified judgement. The principle is that interpretation should not depend on discovering afterward which measure looks best.
The comparison also needs a stable definition of the intervention. If staff increase outdoor-air delivery, relocate portable units and change their fan settings together, the result describes the combined change. It cannot separately identify the contribution of each adjustment without a design that distinguishes them. That may be entirely appropriate when the goal is evaluating a complete building strategy. It becomes misleading only if a report credits one component with the whole result. Naming the intervention at the same level as the comparison is a simple way to avoid that error.
A plan should also allow for a null or mixed result. A particle metric could improve while carbon dioxide changes little. One location could improve more than another. An operational problem could prevent the intended intervention from being delivered. These outcomes are informative if the investigation records enough context to distinguish them.
Uncertainty should be described at several levels. Instrument uncertainty concerns measurement. Spatial variation concerns which air was sampled. Temporal variation concerns when sampling occurred. Statistical uncertainty concerns the estimated comparison. Transferability concerns whether the result applies elsewhere. A single error bar usually captures only part of that list.
The most useful final report is consequently a chain of reasoning rather than a single score. It connects the question, the intervention, the measured quantity, the conditions and the interpretation. A reader can then see both the improvement and its boundaries, including what would need to be measured again after the room or its use changes.
Making the invisible service visible
Indoor-air improvements are easy to describe as purchases: a cleaner, a filter, a sensor or a ventilation upgrade. Their value is delivered through operation in a real space. The measurement task is to establish that service without asking one instrument or one laboratory rating to certify everything people breathe.
A useful public account would identify the room and its use, the relevant pollutant, the control pathways, the operating schedule and the measurement basis. It would distinguish occupied time from empty time and measured concentrations from inferred health effects. It would preserve the date and conditions of the evidence instead of presenting a commissioning snapshot as a permanent property of the building.
The result need not be a complicated dashboard. A small number of well-chosen measurements with clear definitions can be more informative than a large collection of unexplained scores. A particle trend, a contextualised carbon dioxide record and verified system information each contribute something different. Their relationship is what makes the evidence useful.
The imagined classroom's green light would then become one observation among several, rather than the final verdict. People could understand what changed when the fan setting changed, what the window affected and which periods the average describes. Testing the air that people actually breathe begins there: with a specific question, an appropriate measurement and an honest account of the conditions under which the answer holds.