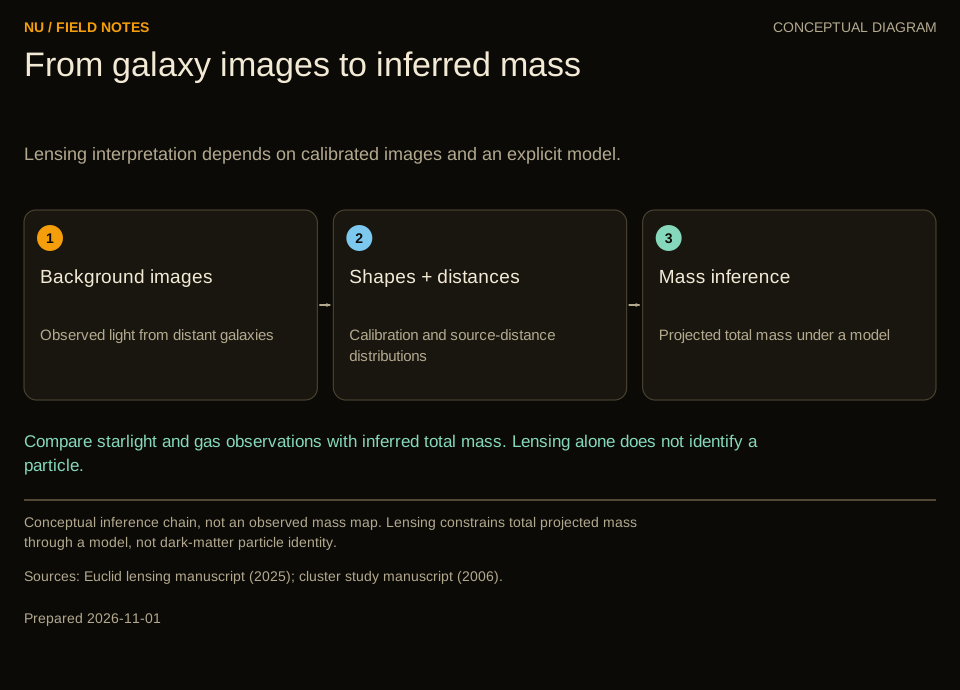
Conceptual inference chain, not an observed mass map. Lensing constrains total projected mass through a model, not dark-matter particle identity.
The colored map is the end of a calculation
On 5 June 2026, the Euclid Consortium highlighted a weak-lensing demonstration using the galaxy cluster Abell 2390. The images showed ordinary galaxies; an accompanying reconstruction showed where gravitating matter was inferred to lie. The consortium presented this as a pilot for the mission's wider program, not a completed measurement of the whole dark universe. The underlying weak-lensing manuscript had first appeared in July 2025. A 2026 announcement date should not be mistaken for the date when all its observations were taken. Euclid Consortium, dated account.
The visual transformation is compelling. Small galaxy images become short oriented marks; those marks become a smooth distribution; the distribution is displayed over the luminous objects. Yet the final color is not light emitted by dark matter. It represents an inference from how gravity has altered light that originated elsewhere.
This matters because several different scientific achievements can look similar in a popular illustration. Detecting coherent gravitational distortion is one achievement. Reconstructing a projected mass distribution is another. Showing that the known stars and gas cannot account for that distribution is a further comparison. Establishing the microscopic identity of the missing component requires evidence beyond a colored lensing map.
The distinctions do not make lensing a weak argument. They make its force intelligible. Lensing measures something that an ordinary image does not: how the gravitational field changes the paths and relative separations of arriving rays. Its great advantage is sensitivity to matter whether or not that matter shines. Its central limitation is equally important: several arrangements of matter, source structure and observing geometry can leave related imprints.
A lens changes a bundle of rays
A distant galaxy has an extended image because its different emitting regions send light along slightly different paths. A gravitational field changes those paths by different amounts. A uniform shift would move the image without changing its shape. Variation across the bundle produces the stretching and magnification that make lensing useful.
A local lens mapping combines isotropic focusing, called convergence (kappa), with directional distortion, called shear (gamma). In the thin-lens description, convergence is projected surface mass density divided by a geometry-dependent critical density; shear follows spatial variation of the same projected potential. Wright and Brainerd, 1999 manuscript.
An original matrix example shows what those terms do. Choose coordinates aligned with the shear, let kappa equal 0.10 and the shear magnitude equal 0.05, and assume the local approximation applies. The two image-to-source scale factors are 1 minus kappa minus gamma and 1 minus kappa plus gamma: 0.85 and 0.95. A small circular source is therefore stretched by factors of about 1.176 and 1.053 in the corresponding image directions. Its area is enlarged by about 1.238.
These are invented dimensionless values, not measurements of Abell 2390. They illustrate why shape and magnification carry related but different information. The ratio of the two stretches changes ellipticity; their product changes area. Neither calculation identifies whether the underlying density consists of stars, gas or a nonluminous component.
The unlensed galaxy is missing from the experiment
There is no ordinary before-and-after picture of the same remote galaxy with the foreground gravity switched off. An elongated galaxy might have been elongated before its light encountered the lens. The weak-lensing measurement therefore relies on populations, not on declaring every oval a gravitationally stretched circle.
Kaiser, Squires, Fahlman and Woods described cluster weak lensing as a statistical anisotropy in faint background-galaxy images. Their 1994 work is an early example of extracting coherent distortion from a population whose individual shapes are unknown. The principle remains relevant even though instruments and estimators have changed. Mapping the Dark Matter in Clusters.
For an idealized statistical exercise, give one calibrated shape component a random scatter of 0.30. Averaging 900 independent, equally weighted examples reduces the uncertainty in the mean to 0.01. A common distortion of 0.02 can begin to emerge from a population in which it is visually unremarkable in any individual member. Increasing the sample to 3,600 reduces that particular random uncertainty to 0.005.
The square-root improvement depends on independence and on the estimator actually being calibrated. If all galaxies acquire a common spurious component of 0.003 from the instrument, increasing their number does not average it away. Nor does a galaxy count alone express the information content: very noisy objects may receive little weight, and correlations can reduce the effective number of independent measurements.
Shapes also have two components. Their meaning depends on a chosen coordinate system. Around a cluster, investigators often rotate them into tangential and cross components relative to an adopted center. A coherent tangential pattern is physically suggestive, but an incorrect center changes that pattern. The center is part of the analysis, not a harmless decorative point placed beneath the image.
The telescope has its own preferred shapes
Before a galaxy image reaches the catalogue, the telescope and detector have blurred and sampled it. The response to a point source is called the point-spread function, or PSF. If it is elongated, an intrinsically round source can look elongated. Even a circular blur makes a small elongated galaxy look rounder and changes the response of its measured shape to gravitational shear.
Euclid's LensMC method uses forward modeling: it predicts galaxy images after convolution with the PSF and compares them with the data, while treating other galaxy properties as nuisance parameters. Its 2024 methods paper tests the approach with simulated images and explicitly examines model mismatch. This is a measurement strategy with documented tests, not a promise that all future images automatically meet a calibration requirement. Congedo and colleagues, LensMC.
For a simple illustration, imagine representing a galaxy and a circular blur by Gaussian profiles. Their second-moment matrices add under convolution. If the galaxy has moment values of four and two along its principal directions, and the blur contributes two in both directions, the observed values become six and four. The difference remains two, but the sum rises from six to ten. A shape measure based on difference divided by sum is reduced from one third to one fifth.
Real galaxies are not all Gaussians, and practical estimators employ weights and more elaborate models. The example isolates the reason that merely measuring the apparent oval is insufficient. Recovering the gravitational response requires knowing how blur changed the relationship between the underlying structure and the measured statistic.
Stars supply empirical samples of the PSF, but only at particular locations, brightnesses and spectral colors. An interpolation across a detector can miss spatial structure. A wavelength-dependent response can make a stellar calibration imperfect for a galaxy with a different spectrum. These are concrete questions for calibration images and simulations, not reasons to dismiss the entire measurement.
Calibration includes the objects that were rejected
Suppose an analysis measures a mean shape component of 0.016. If its response to an applied shear is 0.80, a simplified calibrated estimate is 0.016 divided by 0.80, or 0.020. Treating the raw shape statistic as the shear would underestimate the signal in this invented example. The response is an experimentally investigated property of the measurement procedure.
Metacalibration makes that idea operational by applying small artificial shears to image data and measuring how the estimator responds. Sheldon and Huff's 2017 paper develops treatment of both shear response and selection effects, while also addressing correlated noise introduced by the procedure. Its demonstrated performance belongs to the stated tests; it should not be detached from them as a universal accuracy guarantee. Practical Weak Lensing Shear Measurement with Metacalibration.
Selection is essential because changing a galaxy's shape can change whether it enters the sample. A detection threshold may favor objects whose light is concentrated in a way the algorithm recognizes. A quality cut may retain galaxies aligned with one instrumental direction more readily than another. Calibrating shapes only for the objects that survive does not necessarily calibrate the change in membership.
A thought experiment separates these effects. Start with a population whose intrinsic orientations are balanced. Apply a small shear and imagine that twenty marginal detections now pass a threshold while twenty others fail. Even if the shape estimator is perfect for every retained object, the retained population need not have the same orientation distribution as the original one. The selection rule has become part of the response.
Blended images complicate the boundary of an object itself. Two overlapping galaxies can be detected as one, or assigned pixels differently by alternative algorithms. If they lie at different distances, their light has also experienced different lensing geometry. A realistic calibration must test the detection and separation process, rather than only isolated, perfectly labeled galaxies.
Distance supplies the mass scale
The critical surface density contains source angular-diameter distance divided by the product of lens distance and lens-to-source distance. Cosmological angular-diameter distances cannot generally be subtracted as on a Euclidean ruler.
The lensing-efficiency ratio is lens-to-source distance divided by observer-to-source distance. Foreground sources are not lensed by the proposed lens; sources just behind it have different efficiency from more distant ones. Mass inference therefore needs a source-distance distribution as well as calibrated shapes.
Hold the lens distance and profile shape fixed in a hypothetical weak-shear calculation. If the true mean efficiency is 0.50 but the analysis assumes 0.40, matching the observed shear requires a mass normalization larger by 0.50 divided by 0.40: a factor of 1.25. A twenty-percent underestimate of this efficiency produces a twenty-five-percent overestimate in the normalization in that deliberately linearized setup.
Photometric redshifts estimate distance information from measurements through several filters. Similar observed colors can arise from different combinations of intrinsic spectrum and redshift. For lensing, the task is often to calibrate the distribution of redshifts in a selected population rather than assign an infallible distance to every galaxy.
The DES Year 3 redshift-calibration study combined photometric information, clustering information and shear-ratio information to construct uncertain source-redshift distributions. Its ensemble approach is important: a single best histogram would hide uncertainty that must propagate into the lensing inference. Myles and colleagues, revised June 2021.
Calibration samples must also represent the objects actually used. A spectroscopic sample rich in bright, easily identified galaxies can misrepresent a faint shape sample. Agreement for convenient calibrators does not establish agreement in parts of color and brightness space where secure distance information is sparse.
Cluster members can dilute their own cluster's signal
The most conspicuous galaxies in a cluster image are often the wrong objects for measuring that cluster's background shear. They belong to the lens rather than lying well behind it. If they enter the supposed background population, they can dilute the mean distortion attributed to the cluster.
The Abell 2390 weak-lensing analysis used three shape-measurement methods, combined Euclid and Subaru photometry, calibrated redshift distributions and corrected residual cluster-member contamination. It found consistent mass constraints across its shape catalogues and distance-bin checks. The convergence pictures were used for illustration; quantitative mass constraints came from fitting reduced-shear profiles. Schrabback and colleagues, July 2025 manuscript.
An intentionally simple dilution example assumes equal weights and no intrinsic alignments. If eighty percent of the selected objects are background galaxies with mean tangential signal 0.04, while twenty percent are unlensed contaminants with zero mean, the combined signal is 0.032. Dividing by the true background fraction recovers 0.04. An incorrect contamination fraction, however, turns that correction into another source of bias.
A mass map has a resolution chosen by evidence
Converting a sparse, noisy distortion field into a continuous image is an inverse problem. A mathematically permitted reconstruction can contain small peaks created by random intrinsic shapes. Smoothing suppresses those fluctuations, but also broadens real structures. The attractive smoothness of the final image is not a direct measure of the smoothness of matter.
Jeffrey and colleagues compared direct Kaiser–Squires inversion, Wiener filtering and a sparsity-based method using DES Science Verification data and simulations. Different assumptions about noise and the underlying field changed reconstruction performance. The study treats the mapping method itself as something to validate, rather than presenting a unique algorithm-independent picture. Mass-map reconstruction comparison, 2018.
Consider an artificial map containing two narrow peaks separated by one chosen angular unit. Convolution with a kernel much narrower than that separation preserves two maxima, although noise may remain prominent. A sufficiently broad kernel can merge them into one rounded structure. The underlying synthetic mass distribution has not changed; the displayed resolving scale has.
Peak height, peak position and integrated mass need not respond identically. Spreading a fixed contribution over a larger area lowers its maximum. Asymmetric noise can move the highest pixel even while a broad aperture captures nearly the same total. Thus a statement that two maps have different peak heights is incomplete without their smoothing, normalization and uncertainty conventions.
Masks create another complication. Bright stars, detector defects or missing exposures remove information from particular locations. Filling those gaps with an interpolation or prior does not turn the filled region into an observation. A publication should distinguish constrained structure from structure introduced because the reconstruction requires a complete field.
Why image shapes do not determine an absolute density sheet
A particularly instructive ambiguity is the mass-sheet transformation. In its idealized single-source-plane form, multiply a convergence field by a constant lambda and add a uniform term equal to one minus lambda. Rescale the source coordinates accordingly. The image positions and shapes can remain unchanged even though the inferred density normalization differs.
Schneider and Sluse examined this degeneracy and related freedom in strong-lens mass profiles. Their analysis warns that detailed images do not, by themselves, force a unique radial mass model. This is a structural ambiguity in the forward mapping, not a synonym for insufficient computing power. Schneider and Sluse, revised October 2013.
The algebra can be checked with invented numbers. Let convergence be 0.20 and shear 0.08. The reduced shear, gamma divided by one minus kappa, is 0.10. Choose lambda equal to 0.80. The transformed convergence is 0.36 and transformed shear 0.064. Their reduced shear is again 0.10. A shape measurement sensitive to that ratio cannot distinguish the two local cases.
Additional information can constrain the freedom: absolute magnification information, suitable distance information from multiple source populations, stellar dynamics, or boundary and model assumptions. These additions have their own uncertainties. Simply combining more images under an unchanged assumption does not guarantee that the ambiguity has disappeared.
A halo profile is a hypothesis, not a label on the sky
To estimate a cluster mass, investigators often fit a parameterized radial profile rather than sum colors in an illustrative map. This reduces the dimension of the inverse problem and can improve precision, but it also states what family of density distributions the inference is allowed to consider.
The Navarro–Frenk–White profile arose from simulations of gravitationally assembling dark-matter halos. The original study found a common form for spherically averaged equilibrium profiles within the simulated cases and radial ranges. Its usefulness does not make every observed halo exactly spherical, perfectly relaxed or unaffected by ordinary matter. Navarro, Frenk and White, 1997 version.
A radius and a mass must also be defined. For example, M200c denotes mass inside a sphere whose mean density is two hundred times the critical cosmological density at the object's redshift. That is not the same as a projected cylindrical mass inside the same numerical radius, nor as a mass defined relative to the mean cosmic matter density. Comparing numbers without their subscripts can manufacture an apparent disagreement.
An elementary scaling exposes the importance of the boundary. At a fixed reference density and overdensity definition, mass is proportional to the cube of the defining radius. Increasing that radius by ten percent corresponds to a factor of 1.1 cubed, or 1.331, in the defined mass. The calculation is not an error estimate for any survey; it shows why a modest boundary change can accompany a sizable mass change.
Orientation can matter even when the projected data are excellent. A structure elongated along the line of sight can present a different surface density from the same structure viewed sideways. Inferring a three-dimensional spherical mass introduces a deprojection assumption that the two-dimensional picture alone cannot certify.
A strong analysis therefore compares the model directly with the measured quantity over a stated radial range. It checks how centering, concentration, neighboring structures and departures from symmetry affect the result. A precise parameter estimate within one profile family is not equivalent to a precise measurement over every physically plausible family.
Strong lensing ties several images to one source
Near favorable alignments, one distant source can appear in several places. Extended sources can form arcs or partial rings. The leverage comes from requiring different image regions to correspond to the same underlying source after the proposed gravitational mapping is applied.
This is more restrictive than fitting every bright arc independently. A knot reconstructed from one image should appear in the appropriate location and orientation in another. Surface-brightness structure supplies many related constraints, provided the effects of blur, noise, foreground light and wavelength-dependent source morphology are modeled.
Warren and Dye's semi-linear inversion formalized a useful separation: for a fixed mass distribution, solving for a pixelized source can be a linear problem, while searching the mass-model parameters remains nonlinear. Their paper also considers regularization, which limits unstable source structures. Semi-linear gravitational lens inversion, 2003.
Imagine two candidate mass models that both reproduce the broad outline of a ring. One maps three bright features into a consistent compact source; the other requires unrelated, very narrow source features placed to compensate for small image residuals. The second might reduce a numerical residual while making greater use of source flexibility. Comparing the models requires accounting for that flexibility, not just celebrating the smallest mismatch.
Conversely, an overly smooth source model can force genuine source clumps to be explained by artificial structure in the lens. The direction of the mistake can reverse depending on which component has been made too rigid. Testing several physically defensible source representations helps reveal that exchange.
Image identification is another physical input. Similar colors are suggestive, but spectra and resolved morphology can establish that separated arcs are images of the same galaxy. An incorrect association imposes a false constraint on the mass model. More assigned images do not improve an inference if some assignments are wrong.
Joining the cluster core to its outskirts
Weak and strong lensing emphasize different parts of many cluster systems. Strongly distorted images can provide detailed constraints in a small central region. Weak distortions from many background sources can trace a much broader area, where individual images do not obviously announce the lens.
Diego and colleagues combined those regimes for Abell 2390 in a paper published in A&A in 2026. Their analysis connected central strong-lensing information with wide-field Euclid weak-lensing measurements to constrain the cluster profile across a larger radial range. The result is a combined model with complementary leverage, not a direct three-dimensional photograph. Published Abell 2390 study.
The combination is most informative when the two regimes constrain different freedoms. A core-only model can extrapolate poorly to large radii. An outskirts-only fit can permit several central arrangements. Agreement across the overlap tests whether one physical description can account for both, rather than whether two plots can be made visually similar.
Shared inputs require care here too. Source redshifts, foreground light models and assumptions about cluster-member galaxies can influence both analyses. Combining likelihoods as though every ingredient were independent can create overconfidence. A joint analysis must identify which uncertainties are common and which genuinely add new information.
Disagreement is scientifically useful when localized. It might point to an unsuitable smooth profile, a mistaken image association, background contamination or a distance-calibration problem. The right next observation depends on that diagnosis. Another central arc and better photometry of faint outer sources are not interchangeable upgrades.
Small perturbations can reveal otherwise faint structures
A low-mass concentration near an extended lensed image can perturb its detailed appearance. This opens a way to investigate structures whose stars are too faint to inventory directly at the same distance. The information lies in deviations from the mapping produced by the larger lens, not in a new luminous spot placed on the image.
Vegetti and colleagues reported a dark satellite inferred from the Einstein-ring system JVAS B1938+666 in 2012. The significance here is the gravitational route to a low-luminosity structure, not identification of the particles composing it. The reported object belongs to a model-based analysis of a particular system. Gravitational detection of a low-mass dark satellite.
Sensitivity is highly uneven across an arc. A perturbation near a sharp brightness gradient can produce a larger observable residual than the same perturbation projected against a smooth region. Resolution, signal-to-noise, source complexity and the assumed density profile of the perturber all change what can be detected.
For an invented completeness exercise, suppose one trial population contains one hundred small perturbers distributed around a lens. A particular image configuration might reveal sixty near informative bright structures and almost none in poorly illuminated regions. Seeing few perturbers in real data would not establish that few exist until the analysis had accounted for where and how it could have seen them.
The comparison must also include alternatives that create similar residuals. Foreground lens light can be subtracted imperfectly; the PSF can be slightly wrong; the main lens may have structure absent from an overly simple model. A compact dark perturber becomes persuasive when it explains the spatial pattern better than these plausible alternatives across the relevant data.
Population conclusions require the selection function of the lens sample as well as the detection sensitivity within each image. The most spectacular rings may not be a random draw from all galaxies. A catalogue assembled for clear visual lenses can favor particular alignments, concentrations and source properties.
A perturbing halo need not belong to the main lens
Light travels through a long corridor of structure. A small perturbation can arise from matter associated with the principal lens or from a separate halo elsewhere along the line of sight. Assigning every anomaly to a satellite of the obvious foreground galaxy can distort an inferred satellite population.
Despali and colleagues modeled the contribution of line-of-sight halos to substructure lensing. Their study relates detection sensitivity to both halo mass and redshift and examines the ambiguity between lens substructure and intervening structures. The relative contribution depends on geometry and the dark-matter model; it is not a universal fixed correction. Despali and colleagues, revised January 2018.
The physical reason is that a perturbation's influence depends on where it acts along the ray paths. A halo of one mass at one distance can resemble a different mass at another distance over a limited region. With sufficient information, effects from multiple lens planes can help distinguish possibilities, but distance should not be declared measured merely because a fit has assigned a location.
This distinction changes the scientific question. Counting satellites tests the population bound to host halos. Counting all perturbing structures tests a larger volume and a different combination of formation histories. Both are valuable, but their predictions cannot be compared with the same denominator.
It also changes the meaning of a nondetection. If an analysis is sensitive to a particular compact density profile at the main-lens distance, its null result does not immediately exclude every more diffuse profile or every other distance. The forward calculation must translate each proposed population into the images that the observation would actually produce.
A credible constraint on dark-matter physics therefore includes the route from microscopic assumptions to halo abundance and structure, then from halos to lensing observables, then through detection. A gap at any stage can make a numerical particle constraint appear more direct than the evidence warrants.
Separating gravitating matter from luminous tracers
Lensing responds to total gravitating matter in the model, including ordinary matter. To infer a dark component, researchers compare the reconstructed distribution with estimates for stars, gas and other relevant ordinary material. Optical brightness alone is not the complete ordinary-matter inventory.
The Bullet Cluster illustrates why spatial comparisons can be powerful. Clowe and colleagues' 2006 lensing analysis found that the inferred mass distribution lay closer to the galaxies than to the displaced X-ray-emitting plasma, which contains the dominant observed baryonic component in that system. The separation supports a substantial unseen gravitating component rather than a mass map that simply follows the gas. It does not identify a particular particle species. Clowe and colleagues, 2006.
The comparison joins different measurements. X-ray emission depends on gas properties and must be translated into a gas distribution. Starlight requires assumptions about stellar populations to estimate stellar mass. Lensing reconstruction has its own spatial resolution and correlated uncertainty. The displayed overlays need compatible coordinates and an honest account of those differences.
A simplified accounting example makes the logic explicit. Imagine an aperture with a total inferred mass of ten arbitrary units, while independently modeled gas and stars contribute two and one units. Within that specified framework, seven units remain unaccounted for by those components. The arithmetic is easy; establishing reliable totals, matching the aperture and propagating shared uncertainties is the scientific work.
Replacing the gravity model changes the translation from lensing to matter. An alternative must explain the spatial pattern and other relevant observations, not merely adjust the strength of an attraction at one radius. Conversely, one successful lensing map should not be promoted into a proof excluding every imaginable modification of gravity. The evidential burden is a comparison of explicit predictions.
Cosmic shear asks about a population of structures
Across wide sky areas, weak lensing can be analyzed statistically without assigning every distortion to a named cluster. Correlations between galaxy-shape components at different angular separations probe the intervening distribution of matter. Sorting sources by distance adds information about which parts of the cosmic path contribute.
This observable is not a literal count of dark particles or even a simple count of halos. It combines structure on different scales, lensing geometry and the growth of matter clustering. A cosmological model predicts those ingredients together, and the analysis tests which parameter combinations reproduce the correlations.
The DES Year 3 cosmic-shear analysis presented by Amon and colleagues tested its results across redshift bins, angular scales and calibration choices. It identified modeling of intrinsic alignments and baryonic effects as important limiting uncertainties for that analysis. This is a dated example of a full inference program, not a claim that its parameter estimates are the latest available cosmic census. Amon and colleagues, published 2022 analysis.
An elementary covariance example shows why many plotted points do not necessarily mean many independent tests. Suppose two angular bins respond strongly to the same structures and share many source galaxies. Moving one model parameter can shift both predictions together, while a noise fluctuation in one can be correlated with the other. Ignoring that covariance can overstate the apparent amount of evidence.
The same issue affects comparisons between surveys covering overlapping sky. Independent telescopes can reduce common instrumental errors, but they may still observe some of the same cosmic structures. Their fluctuations are not automatically independent. The comparison becomes stronger when those shared contributions are represented rather than forgotten.
Parameter summaries are useful only with their model context. A combination that is tightly constrained under one expansion history or matter model may be less precise when that model is broadened. A narrow error bar describes an inference under stated assumptions; it is not a universal property of the observed sky.
Galaxies can align before their light is bent
The statistical argument for weak lensing needs more than a large sample. Galaxy orientations need not be entirely random with respect to the surrounding matter. Formation and tidal environments can correlate intrinsic shapes, creating a physical contribution that is not gravitational distortion of the photons.
Hirata and Seljak showed that intrinsic alignments can also correlate with the gravitational shear affecting more distant sources. This means that excluding pairs close together in redshift does not necessarily remove every alignment-related contribution. The relevant interference involves the shared tidal environment, not simply two nearby galaxies pointing the same way. Intrinsic alignment–lensing interference, corrected author version.
A conceptual example uses a foreground population whose intrinsic orientations respond to an elongated matter distribution. That same matter distribution lenses a more distant population. Correlating the two sets of observed shapes can then combine an intrinsic response in the nearer sample with a lensing response in the farther sample. Treating the entire correlation as photon deflection would assign the wrong physical origin to part of it.
Mitigation can involve population modeling, distance information and tests using galaxy properties that trace different formation histories. But a more flexible nuisance model can also weaken the cosmological constraints. That is not necessarily a failure: some of the apparent precision in a rigid model may have come from assuming away an uncertain contribution.
Internal checks have particular scopes. A statistic expected to vanish under an idealized lensing model can reveal some problems when it is nonzero. A result compatible with zero, however, does not certify that every contaminant is absent. A contaminating process can share the symmetry of the desired signal.
Ordinary-matter physics reshapes the dark-matter test
Even when dark matter dominates a halo's mass, gas cooling, star formation and energetic feedback can change the distribution of total matter. Gas can move outward; concentrated ordinary matter can alter the surrounding gravitational structure. A lensing prediction based on a simulation containing only collisionless dark matter is therefore not automatically sufficient at every spatial scale.
Van Daalen and colleagues used a suite of simulations to investigate how galaxy-formation processes change the matter power spectrum. Their 2011 study showed why baryonic physics, particularly feedback, cannot simply be ignored in precision lensing predictions. Its specific numerical effects depend on the simulated prescriptions and scales; the durable point is that ordinary-matter processes affect the observable used to test dark-matter models. Galaxy formation and the matter power spectrum.
Imagine two theoretical explanations that both reduce small-scale clustering. One changes the properties of the dark component; the other moves gas and modifies halo structure through feedback. If a lensing analysis measures only the resulting suppression over a narrow range of scales, it may struggle to distinguish them. Wider scale coverage and independent gas observations can create additional tests.
Discarding uncertain small scales is one defensible response, but it sacrifices information. Modeling them introduces parameters and dependence on simulations. Calibrating those parameters against observations can recover leverage, provided the calibration data do not silently impose the conclusion being tested.
The comparison should also use consistent definitions. A simulated halo mass, a projected lensing aperture and a fitted spherical mass are not interchangeable outputs. A translation between them can depend on structure and selection, precisely the quantities under investigation.
This makes lensing a meeting point between cosmology and galaxy physics rather than a way to avoid the latter entirely. The clean gravitational dependence of light propagation does not remove the complexity of predicting where matter has ended up.
Three-dimensional maps remain broad in depth
Distance-binned sources allow more than a single projected picture. A mass concentration influences sources behind it but not those in front, so changes across source populations can help locate structure along the line of sight. That is the foundation of lensing tomography and three-dimensional reconstruction.
Simon, Taylor and Hartlap developed a minimum-variance reconstruction using galaxy shapes and redshift information. They described radial spreading and shifting of recovered structures caused by noise and the broad lensing response. Those limitations are important when a visualization presents sharply separated depth slices. Unfolding the matter distribution with three-dimensional weak lensing, 2009.
A toy reconstruction illustrates the issue. Place one artificial concentration in a narrow distance interval, then infer its location using source populations with broad, overlapping redshift distributions. Several neighboring mass slices can produce similar changes in the measured shear. A reconstruction may spread the inferred contribution across them, or prefer one location because of its prior.
The apparent thickness of the recovered structure is then partly the response of the measurement procedure. It need not equal the physical thickness of the actual object. Conversely, a regularization method that concentrates mass into a narrow slice may create a sharper-looking result without adding distance information to the data.
Validation can inject structures at known distances into simulated observations and examine where the reconstruction puts them. The test should vary the properties relevant to the real sample rather than use only an ideal configuration that matches the algorithm's assumptions. Reporting the response in depth is as important as reporting angular resolution.
What would make the next dark-matter claim stronger?
The next useful observation depends on the inference that is currently weakest. For a cluster mass normalization, better source-distance calibration may matter more than a slightly sharper central image. For a small perturbing halo, resolving detailed arc structure and testing foreground-light subtraction may be decisive. For cosmic shear, improved gas and intrinsic-alignment modeling can be as important as more galaxies.
A proposed particle model must meet a longer chain of tests than a projected-mass reconstruction. It predicts the formation and internal structure of halos, which must be evolved through ordinary-matter effects and survey selection before comparison with the observations. A claim that one density feature establishes a particle identity skips that chain.
Gravitational lensing has made otherwise inaccessible matter distributions experimentally approachable. The progress is not that astronomers have learned to photograph darkness directly. It is that changes in distant light can constrain mass without requiring that mass to glow. Knowing exactly which inference a lens supports is what allows the technique to say something profound about the invisible universe without pretending it has already answered every question about its contents.