An animal can return to a disturbed patch of seabed without the patch returning to its former ecological condition. That distinction runs through the emerging evidence about mining polymetallic nodules. Researchers can observe a moving animal, count organisms in sediment, identify microbial communities or measure recently deposited particles. Each observation answers a different question. Collapsing them into a verdict that the deep sea has either recovered or been permanently emptied loses much of what the research actually establishes.
The policy setting also needs a date. In its September 19, 2026 account of the year's proceedings, the International Seabed Authority described continuing negotiations on draft exploitation regulations, a requested roadmap and further work towards its next session. That institutional account supports a description of an unfinished negotiating process at that point. It does not turn an experimental collector trial into authorized commercial exploitation, and it does not resolve every jurisdictional dispute over seabed activity. This article examines ecological evidence rather than offering a legal determination. ISA's dated session account
There are now experiments with very different observation windows: months after a modern collector test, decades after older disturbance, and measurements made while sediment was moving through the water. Their value lies partly in their differences. A recent test can show what contemporary equipment does locally. An old track can reveal persistence that no short modern campaign could observe. Neither supplies a complete preview of repeated operations over a much larger area.
The central ecological question is therefore a sequence of questions. What habitat was removed? What material was displaced? Which organisms were exposed, and for how long? Which populations, interactions and functions changed? What could supply recolonists, and what conditions would they encounter? A useful assessment follows that sequence without pretending that every link has already been measured.
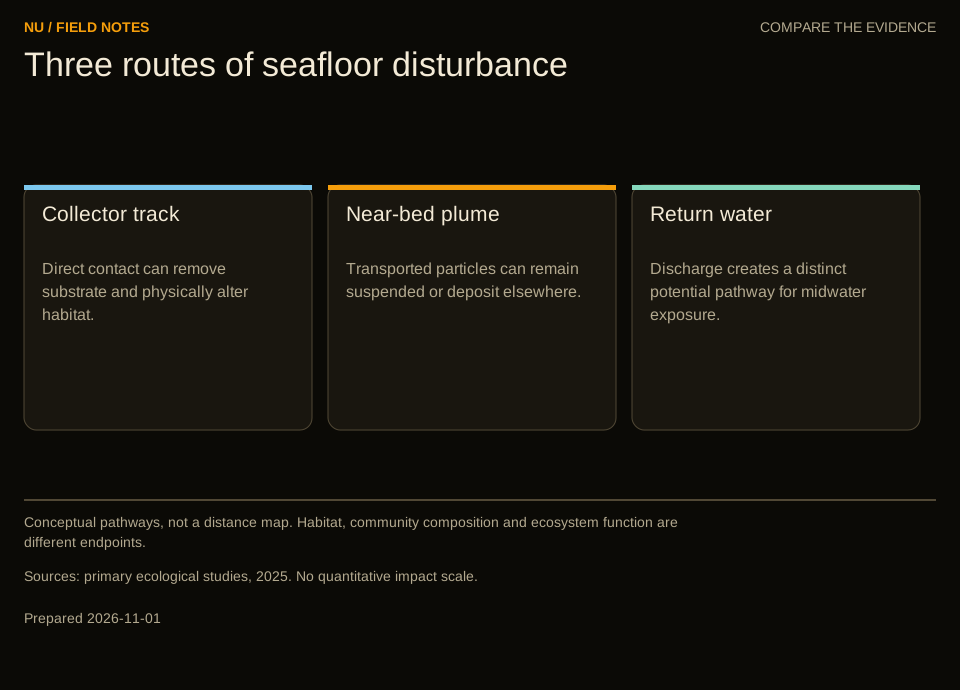
Conceptual pathways, not a distance map. Habitat, community composition and ecosystem function are different endpoints.
A nodule field contains several kinds of habitat
A seabed photograph encourages an understandable visual shortcut. Dark nodules stand out against pale sediment, so the scene appears to consist of rocks scattered across mud. For an ecological survey, however, those visible objects and the material around them are separate sampling domains. An organism attached to a hard surface, a small animal living inside sediment and a microbe associated with a nodule interior are not interchangeable entries in one census.
A 2016 primary study by Ann Vanreusel and colleagues compared video surveys across four exploration areas with different nodule coverage. It found higher epifaunal densities where nodules were abundant and reported that some coral groups were virtually absent from nodule-free areas. The study concerns the visible fauna and environments it sampled. It supports the importance of hard substrate there, rather than establishing a universal density multiplier for every abyssal region. Vanreusel and colleagues, primary abstract
Imagine two hypothetical survey squares with equal total animal counts. In the first, most animals are attached to nodules. In the second, most move across sediment. A removal operation that takes away the nodules would not present the same disturbance to both assemblages. Reporting only the initial total could conceal the feature most relevant to their response. This is an analytical example, not an estimate for a particular contract area.
The distinction becomes sharper when considering replacement. Bringing an animal into a cleared square would not recreate the attachment surface it previously used. Adding an artificial surface would create another intervention whose chemistry, roughness, stability and biological colonization would need testing. It would not establish equivalence simply because both objects are hard. Habitat substitution is an empirical proposition, not a consequence of a shared label.
An adequate baseline therefore needs to describe what is present at more than one level. Visible animals are useful because images can cover relatively broad areas. Sediment samples reveal organisms that photographs miss. Nodule samples address another set of associations. None should be quietly promoted into a complete inventory of the others. The appropriate unit depends on the question: area of seabed, volume of sediment, individual nodule or sampled mass can each be defensible, but they produce different denominators.
For a reader comparing studies, this means checking the sampling target before comparing the result. A change in animals per square metre cannot be directly equated with a change in genetic sequences per sediment sample. Even two area-based measures may use different size cutoffs. Apparent disagreement can arise because investigators deliberately observed different components of the same environment.
A field experiment has a footprint and a history
A collector trial should be described by what actually happened: where equipment travelled, how it interacted with the bed, which material was removed, how long it operated and where other discharges occurred. A rectangle marking the test area is useful for navigation, but it may be a poor ecological exposure map. Some parts may have been crossed repeatedly, others once, and others not at all.
The history matters just as much as the outline. A study published in December 2025 by Eva Stewart and colleagues examined sediment-dwelling macrofauna around a 2022 collector test, using observations from two years before and two months after the disturbance. Within tracks, density fell by 37% and species richness by 32%. Sample-size-independent diversity measures told a different part of the story. In the plume-affected area, the researchers found no abundance change but did find altered dominance relationships. Those are distinct outcomes, not evidence that every biological metric changed identically. Stewart and colleagues, primary study
One reason to preserve these distinctions is that fewer collected individuals can itself make fewer species appear in a sample. Suppose, hypothetically, that a core contains twenty animals before a disturbance and ten afterwards. Rare species are less likely to appear among ten draws than among twenty. That does not make the density loss unimportant. It means that a claim about species loss needs to distinguish lower abundance from a changed distribution of species.
Conversely, an unchanged total can conceal a redistribution. Consider a hypothetical sample with four species represented by twenty-five individuals each. A later sample also contains one hundred animals, but ninety-seven belong to one species and the remaining three species have one each. Abundance and species count are unchanged. Dominance has shifted substantially. Which measure matters depends on the ecological question; none should erase the others.
There is also a difference between detecting a local response and identifying its mechanism. A decline within a track could combine direct removal, burial, altered sediment properties and later movement. Separating those processes may require additional measurements or experiments. A field impact estimate does not automatically identify the contribution of every pathway, even when the before-and-after contrast is convincing.
These considerations should make reporting more precise rather than more evasive. A concise statement can name the organisms, exposure zone, observation interval and measured response. That gives the reader enough structure to understand what was established. Broad words such as biodiversity, impact and recovery can then be used as summaries instead of substitutes for the evidence.
Why the comparison site cannot be an afterthought
A test area may change even without equipment passing through it. Natural variation in food supply, sediment conditions and the distribution of organisms can produce differences across space and time. The inferential problem is to estimate the change attributable to disturbance against that moving background. A nearby site is not automatically a suitable comparison merely because it was not crossed by the collector.
Consider a hypothetical study with a future track site and an undisturbed comparison site. Before the trial, the measured density is fifty at the track site and forty at the comparison. Afterwards it is thirty and thirty-five respectively. The simple track decline is twenty. A difference-in-differences calculation compares that with the comparison decline of five, yielding an additional decline of fifteen in the track site. This arithmetic illustrates a design principle; it is not a result from any cited experiment.
The calculation still depends on assumptions. If the two locations would have responded differently to natural change, subtracting one trend from the other may misattribute part of the difference. If the supposed comparison receives sediment from the trial, it is no longer unexposed. If sampling methods change between visits, the calculation can include a measurement change. More algebra cannot repair a comparison whose ecological meaning was never established.
Before-disturbance observations help reveal whether sites already differ and whether those differences are stable. Replication helps distinguish a consistent response from an unusual patch. Environmental measurements help investigators understand why some locations are unlike others. These are complementary protections. A large number of photographs from one transect does not necessarily provide the same independence as several genuinely separate survey locations.
This issue is especially important when rare organisms are part of the concern. Failure to observe a rare species after disturbance might reflect a real decline or limited detection. Finding one individual proves presence at that moment but says little about population size, reproduction or persistence. A strong report keeps those propositions separate and states what additional sampling could discriminate among them.
For the public reader, the practical question is whether a study's design can support its headline. Look for a map of actual exposure, a timeline of observations, consistent sampling definitions and a description of controls. A claim becomes easier to assess when the comparison is visible. A chart without those details can be visually clear while remaining scientifically ambiguous.
The moving sediment has more than one boundary
Disturbance can remove material from one place, keep some suspended and deposit some elsewhere. The resulting plume changes through time. A single distance assigned to it can refer to an instrument's detection limit, the edge of a survey, a particular concentration contour or a measured sedimentation signal. Those boundaries should not be treated as synonyms.
A January 2025 study by Iason-Zois Gazis and colleagues monitored a pre-prototype collector trial at approximately 4,500 metres depth. Its primary abstract describes a downslope gravity current and current-driven dispersion extending to the monitoring area's boundary, 4.5 kilometres away. Concentrations varied strongly with height and distance; the study also measured redeposition near collection lanes. The farthest observation was an observational boundary, not a demonstrated universal limit of ecological effects. Gazis and colleagues, primary abstract
To understand the distinction, imagine three hypothetical sensors placed at one, ten and fifty metres above the bed. The lowest registers a large pulse, the middle a smaller one and the highest no detectable increase. That pattern would describe the sampled water at those locations and times. It would not establish that organisms closer to the bed avoided exposure, nor that a distant sensor would necessarily see the same vertical pattern.
Concentration also needs a time dimension. A brief high pulse and a prolonged low exposure can contain different implications for an organism's feeding or ability to clear particles. Multiplying concentration by time can be a useful exposure descriptor, but it does not establish a universal biological dose-response curve. Particle properties, feeding behaviour and intermittent recovery opportunities may matter as well.
A hypothetical plume of one milligram per litre lasting ten hours has the same simple concentration-time integral as ten milligrams per litre lasting one hour. That equality is arithmetic. It does not show equal ecological effects. A response may depend on peaks, cumulative exposure, particle size or the sequence of pulses. A monitoring plan should not discard those features merely because they complicate a summary.
Nor should a map of suspended particles be substituted for a map of deposited material. A particle can pass a sensor without settling nearby. Deposited material can remain after the water has cleared. Repeated deposits can accumulate in ways that a short water-column snapshot misses. Linking these observations requires a transport and deposition account that is checked against measurements, rather than assuming that one visible plume image contains the entire history.
Tracing deposition answers a narrower, valuable question
A November 2025 study by Bryan O'Malley and colleagues used naturally occurring thorium-234 as a tracer of recent sediment deposition after the NORI-D collector test. Its primary abstract reports an elevated post-test signal declining to background within one to two kilometres of the directly mined area. The paper discloses partial company funding and two company-employed co-authors. The finding provides a particular geochemical measure of deposition; it does not independently define a safe biological distance. O'Malley and colleagues, primary abstract and disclosures
The strength of a tracer is that it can reveal a process that ordinary imagery cannot resolve well. Its limitation is that its interpretation depends on what it traces. A chemical signal associated with recently deposited particles does not directly count dead animals, measure feeding success or establish reproductive failure. Those outcomes require biological evidence. Combining the two kinds of observation is more informative than asking either to do the other's job.
A hypothetical monitoring team might obtain three maps: visible sediment cover, a tracer signal and changes in community composition. If their boundaries differ, that is a question to investigate, not a reason to choose whichever map supports a preferred conclusion. The maps could refer to different times, thresholds or processes. Organisms could respond where deposition is difficult to distinguish visually, or a tracer could remain detectable where a measured biological response is absent.
Funding disclosures belong in this account because they help readers understand the research context and identify questions about independence. They do not replace examination of the methods. A disclosed commercial relationship is not proof that a result is false; the absence of such a relationship is not proof that a result is correct. Relevant safeguards include transparent methods, accessible observations, clear uncertainty and the possibility of independent reanalysis.
Four decades do not produce one recovery clock
A March 2025 study by Daniel Jones and colleagues revisited an older nodule-mining test after forty-four years. The primary abstract reports persistent changes in directly disturbed areas alongside re-establishment of several groups of organisms. Some plume-affected assemblages had abundances similar to controls, with limited detectable residual sedimentation effects. The authors also distinguish the older equipment's disturbance from aspects of modern collector design. The result supports long-lived alteration and partial recolonization together, rather than an all-or-nothing recovery verdict. Jones and colleagues, primary abstract
Recovery needs an endpoint before it needs a percentage. A return in total abundance, a return in species composition and a return in habitat structure could occur on different schedules. If an assessment changes its chosen endpoint after observing the results, it can make the same site appear recovered or unrecovered without anything changing on the seabed. Defining the endpoint in advance reduces that flexibility.
A hypothetical cleared patch illustrates the problem. Mobile animals arrive first, and their count eventually resembles that of a nearby reference patch. Attached organisms remain scarce because the original attachment surfaces are absent. Sediment organisms show a different trajectory again. Calling the patch recovered on the basis of the first measure would overstate what was observed. Calling it devoid of life would also be wrong.
There is a further distinction between an organism arriving and a population sustaining itself. An individual photographed in a track could be passing through, feeding temporarily or occupying it persistently. Repeated observations, size distributions and reproductive evidence can help separate those possibilities. A single image should be presented as a record of occurrence, not a complete demographic history.
The old experiment also raises a scaling question. A small disturbed patch may lie close to undisturbed sources of recolonists. A much larger disturbed region can change the distances and routes involved. That does not justify assigning a specific recovery time to the larger operation without evidence. It does mean that the geometry of the experiment is part of the interpretation, not an inconvenient detail to leave out.
The most useful lesson from long observation windows is therefore methodological. Preserve the exposure history, keep returning to the site and measure several ecological attributes consistently. An archive of old coordinates, engineering descriptions and samples can become valuable long after the original trial. Without that continuity, a future expedition may see a distinctive patch but struggle to reconstruct what produced it.
Microbial activity adds another dimension
A 2020 study by Tobias Vonnahme and colleagues examined the DISCOL disturbance experiment twenty-six years after the original intervention. It measured microbial communities and functions rather than relying solely on visible animals. The primary report describes persistent sediment disturbance and locally reduced microbial activity, while its recovery-time estimates were projections rather than observations extending beyond the study interval. These measurements add a functional dimension to the assessment of a disturbed seabed. Vonnahme and colleagues, primary study
Function is an appealing word because it suggests what an ecosystem does, but it still needs a measured definition. Investigators might assess a reaction rate, oxygen consumption or processing of a particular material. Each is a window onto activity under specified conditions. It would be too broad to translate a change in one assay directly into a quantified loss of all ecosystem services.
Consider a hypothetical sediment sample in which cell counts return to a reference level while a measured processing rate remains lower. There is no logical contradiction. The organisms may differ, their physiological state may differ, or the surrounding conditions may limit activity. Counting cells and measuring a rate answer different questions. A robust interpretation asks why they diverge instead of assuming one measure invalidates the other.
Laboratory handling can also become part of the inference. Removing a sample from its environment, storing it and measuring it under controlled conditions can help isolate processes, but it changes the setting. The report should distinguish an in-place measurement from a shipboard assay and a modelled extrapolation. That distinction allows useful experiments without pretending they are continuous observations of the untouched seabed.
This is particularly relevant to claims about restoration. Replacing the appearance of a surface would not demonstrate that its microbial processes had returned. Conversely, a recovered rate in one experiment would not establish that all original species or interactions were restored. Physical, taxonomic and functional evidence should be carried together, with their disagreements treated as information.
For a decision-maker, the implication is to resist one-number ecological accounting. Several indicators can be displayed in a compact report without being forced into a single score. The point is not to make decisions impossible by multiplying measures indefinitely. It is to retain the differences that would change the decision, especially when an intervention removes habitat rather than temporarily changing a water measurement.
Connectivity cannot be assumed from a continuous ocean
A 2026 primary study by Batuhan Cagri Yapan and colleagues compared bacterial communities from nodules, sediments and bottom waters across Pacific nodule regions. It found different community patterns among those substrates, with substantial local variation as well as broader connectivity among abundant taxa. The study's interpretation emphasizes both regional connections and local heterogeneity. It does not support treating surrounding seawater as a guaranteed replacement supply for every community removed from the bed. Yapan and colleagues, primary study
Connectivity has several possible meanings. Similar organisms at two sites can suggest exchange or common environmental selection, but similarity alone is not a direct count of migrants. A current pathway can make transport possible without establishing that arrivals survive. Genetic resemblance can reflect a history longer than the interval relevant to recolonization. An assessment should state which meaning its evidence addresses.
For a hypothetical attached animal, successful recolonization would require more than movement across a map. A reproductive source must exist, dispersal must reach a suitable location, settlement must occur and the organism must survive long enough to contribute to the population. If the necessary substrate has been removed, transport alone cannot solve the habitat problem. Different life histories can make different steps limiting.
A preserved area is therefore valuable partly because of what it contains and how it relates to other habitats, not merely because of its size. Two equally large areas may differ in community composition, environmental conditions and exposure to neighbouring disturbance. A site chosen only because it is commercially unattractive may fail to represent the habitat that is actually being removed.
This is an analytical reason to examine networks rather than isolated boxes. A network can retain several habitat types and potential connections among them. But calling a collection of boxes a network does not establish that the relevant organisms use those connections. That remains a research question, and uncertainty should influence how confidently the network is described.
Local heterogeneity also complicates the idea of an interchangeable reference site. A reference may be useful for tracking environmental trends yet poorly matched for a particular community comparison. One site need not serve every purpose. A carefully explained set of references can be more defensible than a single supposedly representative station carrying all of the inferential weight.
The water above the seabed belongs in the assessment
Nodule collection can involve pathways beyond material displaced at the collector. Where a proposed system handles and returns water and fine particles, the receiving water layer creates another exposure problem. An ecological account restricted to the track would omit that pathway even if its track measurements were excellent.
A November 2025 primary study by Michael Dowd and colleagues examined particles associated with a test operation and their relationship to midwater food webs. Using compound-specific isotope analysis, the researchers identified a potential problem from mixing nutritionally poor mining-associated particles with the particles supporting those food webs. Their result concerns a mechanism and potential consequences; it is not a measured collapse of a commercial fishery or proof that every discharge configuration has the same effect. Dowd and colleagues, primary study
A simple hypothetical mixture explains the distinction. Suppose a feeding organism encounters a fixed volume of water containing ten edible particles. Adding ninety similarly encountered but nutritionally poor particles changes the composition of what it meets. Whether its nutrition declines depends on selection, rejection, feeding effort and the characteristics of the particles. The arithmetic identifies a possible dilution problem without predicting the animal's response by itself.
That is why a food-web inference requires several links. Measurements can characterize particle composition. Feeding studies can examine uptake or rejection. Physiological observations can assess consequences for organisms. Population and food-web studies address wider effects. Evidence at an earlier link can justify concern and further testing without being reported as a completed measurement at every later link.
Changing the discharge depth would change the question rather than erase it. Different receiving layers contain different organisms and physical conditions. A proposed alternative should be evaluated on its own exposure and response pathways. Moving a plume out of one monitored layer does not demonstrate that it has become ecologically irrelevant elsewhere.
The same care applies to words such as dilution. Lower concentration can reduce some exposures, but a larger affected volume can involve more organisms or longer transport. Whether the overall consequence decreases is not settled by concentration alone. A balanced assessment follows both intensity and distribution, avoiding the assumption that a less visible signal is necessarily an absent one.
Repeated operations change the spatial problem
An experiment provides a finite exposure under particular conditions. A proposed operation can involve repeated passes, adjacent strips and continuing material handling. Scaling from one to the other requires an explicit account of what repeats, what overlaps and what has time to change between events. Simply multiplying the result from one small test by the number of planned operating days is rarely a complete ecological model.
For an original geometric illustration, consider a square disturbed patch one kilometre on each side. Its perimeter is four kilometres and its area is one square kilometre, giving a perimeter-to-area ratio of four per kilometre. A square ten kilometres on each side has a ratio of 0.4 per kilometre. The larger square has less boundary per unit area. This does not calculate a biological recovery time, but it shows why access from neighbouring habitat can change with scale.
Patch shape matters too. Several separated strips can have a different relation to undisturbed habitat than one compact block with the same total area. Yet a narrow gap is not automatically an effective refuge: it may receive displaced sediment or lack the habitat needed by the organisms of concern. Geometry is a starting point for ecological questions, not a substitute for answering them.
Repeated plume exposure introduces another temporal structure. A site receiving several pulses before it has responded to the first may not behave like a site experiencing one isolated event. Alternatively, particular particles may clear between pulses while a different property accumulates. A model should make these assumptions visible and test sensitivity to them rather than selecting an apparently convenient recovery interval.
Cumulative assessment also needs to distinguish independent sources from the same source counted twice. A plume model, a tracer map and a photograph may describe aspects of one event, not three separate impacts. Conversely, separate operations can contribute to a shared receiving environment. Careful bookkeeping is needed in both directions: avoid inflated totals from double counting and avoid understated totals from examining each activity in isolation.
The relevant region should follow ecological and transport relationships rather than stop automatically at an administrative boundary. That does not mean every effect extends indefinitely. It means the boundary used in the assessment should have an evidential explanation. The place where a map is cropped is not, by itself, a scientific conclusion about where influence ends.
Choosing the next measurement by the uncertainty it resolves
A practical way to read the evidence is to ask what competing explanations remain possible after each observation. If a survey finds fewer animals in a disturbed area, additional images alone may not resolve whether sediment-dwelling groups show the same response. A sediment sample addresses a different uncertainty. If a plume model predicts deposition beyond the observed stations, extending the observation network may be more informative than increasing the sampling frequency at the same central station.
This is a design exercise, not a recommendation for any particular field campaign. Imagine that a hypothetical research team has resources for one additional comparison. It has strong evidence of local sediment deposition but little information about attached organisms. One option is to refine the deposition estimate; another is to examine the missing biological group. The choice should follow the decision that the evidence must support. Improving an already precise physical measure can leave the decisive ecological uncertainty untouched.
A second hypothetical case concerns apparent recovery. The team has repeated counts but only one early description of species composition. If total abundance has returned to its starting range, another total count may add less than an assessment of which organisms now make up that total. The question has shifted from whether animals are present to whether the community is similar. The monitoring design should be able to shift with the scientific question while keeping enough consistent measurements to preserve the time series.
Negative results deserve this same attention. A study might be able to detect a large density decline but be poorly suited to identifying a small change in a rare species. Reporting no detected effect is appropriate. Describing the result as evidence that all ecologically important effects were absent would require more. Precision about detection is especially useful when different studies produce different apparent outcomes: the difference may involve statistical power or sampling coverage rather than contradictory ecological processes.
Sampling also has a cost to the environment being sampled. A sediment core removes material; some observation systems can disturb the immediate surroundings. Research design therefore involves obtaining informative evidence while minimizing unnecessary disturbance and preserving reference locations for future comparison. That does not invalidate sampling. It reinforces the value of deciding in advance which observations are needed and retaining the resulting material and metadata well enough to avoid preventable repetition.
A restoration claim would need its own experiment
Proposals to repair disturbed seabed should be evaluated as interventions, not accepted or dismissed solely by analogy with restoration on land. A hypothetical project that places replacement attachment surfaces would need to show what colonizes them, how long the structures remain suitable and whether they create unwanted changes nearby. A photograph of a colonized object would be an initial observation, not proof of restored habitat across an operational footprint.
The comparison would also need a clear objective. Restoring a particular ecological function, increasing local abundance and recreating the original assemblage are different aims. A project might contribute to one while falling short of another. Its performance should be assessed against the stated aim, with the remaining differences reported openly. Otherwise a modest, useful result can be inflated into a claim of complete reversibility.
There is an asymmetry between proposing future repair and demonstrating it. A proposal can describe a mechanism and a research plan. Demonstration requires evidence under relevant conditions and over a relevant interval. Financial provision or an engineering drawing may make a project more plausible, but neither establishes a biological outcome. Decisions that rely on restoration should identify which parts are demonstrated and which remain contingent on future success.
This framing leaves room for useful research without turning uncertainty into an unlimited promise. Small experiments can test mechanisms and expose failure modes. Longer observations can determine whether early colonization persists. Independent comparisons can assess whether the result is specific to a favourable location. Each step adds knowledge, while the burden of showing equivalence remains with the actual ecological claim rather than with the attractiveness of the proposed technology.
What a useful public evidence record would contain
A reader should be able to reconstruct the basic chain from activity to observation. That begins with the dates and actual path of the trial, the relevant equipment configuration and the sampling schedule. It continues with the definition of each biological measure and the distinction between direct disturbance, transported material and reference locations. Without those elements, even an attractive dashboard can make unlike observations look comparable.
The record should also separate data availability from data completeness. Publishing a dataset is valuable, but a public file can still contain gaps, uneven coverage or a narrow set of endpoints. A missing sample should remain missing rather than being silently treated as zero. A failure to detect a response should be accompanied by enough information to understand the size of response the study could reasonably have detected.
For biological identification, changes in taxonomy need to remain traceable. If one expedition groups organisms broadly and another identifies them more finely, an apparent increase in richness may partly reflect classification. Photographs, specimens and consistent identifiers can help future researchers revisit those decisions. The goal is not to freeze taxonomy but to preserve the connection between a reported name and the evidence behind it.
For exposure models, public reporting should distinguish calibration from independent testing. A model tuned to match one set of measurements has demonstrated an ability to reproduce those observations under its fitted assumptions. Testing against observations not used in tuning addresses a different question. Both can be useful, but calling calibration validation without qualification gives the model more independent support than it has earned.
Decision thresholds should be explained before they are crossed. A threshold can be based on a measured biological response, a precautionary management choice or an operational trigger for further investigation. Those origins have different meanings. Readers should not be led to believe that every administrative threshold represents a proven boundary between harmless and harmful exposure.
Finally, the record should allow results to remain mixed. A test can show persistent habitat alteration, partial recolonization, limited detectable effects for one endpoint and a concerning response for another. Such a conclusion is not indecisive. It is more useful than a slogan because it identifies the mechanisms, scales and uncertainties that the next decision must actually address.
The deep seafloor's distance from everyday observation makes precision especially important. Most readers will never inspect a collector track or a sediment core themselves. They depend on a chain of measurements and explanations. Protecting the integrity of that chain means reporting what returned, what remained changed, what was never measured and how far the evidence can reasonably travel beyond the experiment that produced it.