A driverless vehicle can travel millions of miles without settling the question that matters on the next street. How much of that experience resembles the street ahead? Which events entered the record? Who was exposed to the risk? A large denominator makes a safety claim more informative, but the denominator has to describe the operation being evaluated.
Waymo's public safety-impact page, checked on October 31, 2026, reports 271.3 million rider-only miles through June 2026 across five operating areas. It compares crash outcomes with human benchmarks and describes rider-only operation as driving without a human driver. Those are the company's published retrospective results, with a defined exposure window; they should not be mistaken for an independent finding that every automated vehicle is safer everywhere. The page also distinguishes retrospective performance from its broader readiness assessment. Waymo's safety-impact evidence
That distinction opens a more useful discussion than either blanket enthusiasm or blanket rejection. A city considering an expanded service needs to understand what existing performance establishes, where uncertainty remains, and what would make the inference stronger. A passenger wants a reasonable account of risk. A pedestrian has an equally legitimate interest even without buying a ride. An engineer needs to discover the situations hidden by an overall average.
The following analysis uses a fictional service called Harborloop and invented numerical examples. None of its rates, incidents or operating decisions describes a real company. The examples show how to interrogate evidence rather than provide a verdict on a product. Sources were checked on October 31, 2026; historical findings retain their original dates. This is an explanation of safety evidence, not legal advice or a recommendation to rely on a particular driving system.
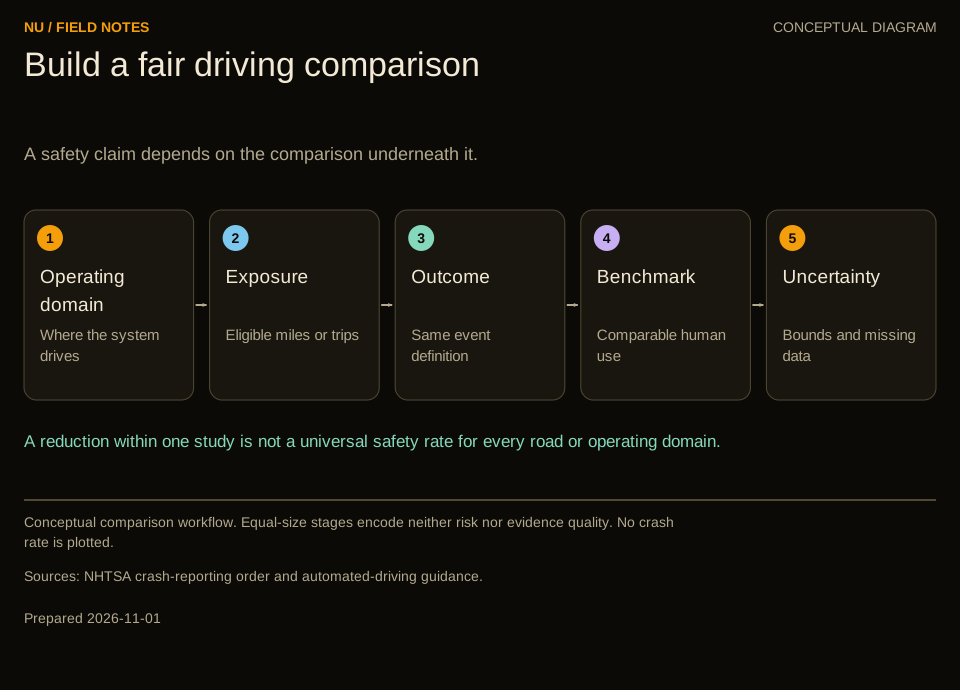
Conceptual comparison workflow. Equal-size stages encode neither risk nor evidence quality. No crash rate is plotted.
Begin with the operation, not the badge
Harborloop's first service area contains a shopping district, residential streets and a railway station. It operates during specified hours and accepts trips only within a mapped boundary. A neighboring district has faster roads, complicated construction and a bridge exposed to different weather. Calling both districts urban does little to establish that performance in one predicts performance in the other.
An operational design domain describes the circumstances for which a driving system is designed. Geography can be part of it, along with road types, speeds, weather, lighting and other conditions. The important editorial question is whether a safety claim identifies those circumstances clearly enough for readers to know what experience is included. A colored service map alone may conceal substantial restrictions within the colored area.
NHTSA's voluntary automated-driving guidance identifies operational design domain, object and event response, fallback, validation and post-crash behavior among its safety elements. The guidance addresses automated driving systems at Levels 3 through 5 and distinguishes its scope from Level 2 assistance. Its list is a framework for discussing development, not a certificate that any vehicle satisfying a checklist is safe. NHTSA's automated-driving guidance
For Harborloop, the domain should be readable as a set of conditions rather than a marketing adjective. If heavy rain suspends service, dry-weather miles should not become evidence of heavy-rain capability. If some intersections are excluded, the exclusion belongs beside the performance result. If a trip can begin in permitted conditions but encounter a closure, the evaluation must also consider the transition out of ordinary operation.
Restrictions are not inherently evasive. Choosing where a system can operate may be an important way of managing risk. But restrictions change the population to which a result applies. A favorable record in a bounded service can be valuable evidence for that service without resolving the safety of unrestricted driving. The error occurs when the boundary disappears between the technical report and the headline.
This also clarifies the role of the human occupant. A person expected to supervise continuously has a different responsibility from a passenger who is not driving. Miles accumulated with a safety operator prepared to intervene represent a different arrangement from miles without that operator. Pooling them without explanation can give a reader an inaccurate picture of what the machine, the person and the surrounding organization actually demonstrated together.
Count the right event before dividing
Imagine that Harborloop reports twelve contacts with other vehicles over a stated interval. The count sounds concrete. Yet a comparison remains impossible until the event definition is specified. Does contact include a scrape while stopped? Does the count include collisions initiated by another driver? Were injuries identified immediately, reported later, or inferred from emergency response? Each choice changes what the number measures.
An event can be classified along several dimensions: whether physical contact occurred, whether someone was injured, whether a vehicle required towing, whether an airbag deployed, and whether the automated system was operating. These dimensions overlap without being interchangeable. One crash might contribute to several outcome categories. Adding category totals can therefore count the same event repeatedly.
A good report tells the reader whether its unit is crashes, vehicles involved, injured people, claims or trips with an incident. Suppose one collision involves two vehicles and three injured occupants. It is one crash, two vehicle involvements and three injured people. None of those numbers is intrinsically wrong. They answer different questions, and a comparison must use matching units on both sides.
Timing matters as well. An injury may not be known when an initial report is filed. A record can be updated after medical information becomes available, or a duplicate can be reconciled after two organizations report the same incident. A changing database is not automatically evidence of manipulation. It becomes difficult to interpret when revisions are invisible and an old chart is compared with a newly corrected extract.
NHTSA warns that its standing-order crash reports should be compared cautiously because entities differ in their access to incident information, vehicle capabilities, operating locations and exposure. A connected fleet may learn of events that another manufacturer discovers only through later complaints. The agency's reporting page therefore supplies context that a simple company-by-company count omits. NHTSA's crash-reporting explanation
The practical implication is to publish a data dictionary before publishing a league table. Harborloop's hypothetical report should define eligibility, severity, automation status and revision rules in language a reader can follow. It should also identify missing information. Treating an unknown injury outcome as confirmed no injury would make the dataset look cleaner while quietly making the conclusion less defensible.
A million miles of what?
Suppose Harborloop records four qualifying crashes in two million eligible miles. Its observed rate is two crashes per million miles. A comparison fleet records twenty qualifying crashes in five million eligible miles, or four per million. Under those definitions, the observed rate ratio is one half. That arithmetic does not yet establish that Harborloop's technology caused the difference.
The comparison could differ in road speed, congestion, time of day, vehicle age, weather or trip purpose. Perhaps Harborloop avoids conditions that the other fleet must serve. Perhaps it spends more time in crowded low-speed streets where minor contacts are relatively visible. A rate can be calculated perfectly and still compare populations that are poorly matched for the question being asked.
Vehicle miles are a useful denominator for many crash analyses because they describe distance traveled. They are less informative for some other questions. A service that waits at crowded curbs may create interactions without accumulating much distance. Passenger miles describe transport delivered, while vehicle miles also include empty repositioning. Trips describe access to a service but vary enormously in length. The denominator should follow the outcome and decision.
Consider two fictional services carrying the same number of passengers over the same passenger distance. One drives many additional empty miles to meet demand. Its crash rate per vehicle mile could look favorable while its total exposure per passenger trip is higher. This does not prove the service is harmful; it shows why operational efficiency and per-mile driving performance are different parts of the assessment.
A city might reasonably request several views: injury crashes per vehicle mile, passenger exposure, incidents affecting nonoccupants, and total relevant events over the period. Showing multiple denominators is useful when their purposes are explained. Presenting whichever denominator produces the smallest-looking number, while suppressing the others, creates a selective account of a service that occupies shared streets.
Even the mileage total needs boundaries. Does it include manual relocation, closed-course testing, simulation or only public-road automated operation? Does the numerator cover precisely the same fleet and dates? A crash from a newly added city paired with mileage only from older cities would be mismatched. So would a lifetime mileage total paired with incidents from a single recent quarter. Before debating the rate, check that its two halves belong together.
Matching the road mix can reverse the impression
A small invented example shows why aggregate comparisons deserve care. Divide roads into a lower-risk category and a higher-risk category. Suppose a human comparison has rates of one and ten qualifying crashes per million miles in those categories. Harborloop has corresponding rates of two and twelve. Within each category, Harborloop's observed rate is higher in this example.
Now suppose Harborloop drives ninety percent of its miles in the lower-risk category, while the human population drives only twenty percent there. Harborloop's combined rate is 0.9 multiplied by two plus 0.1 multiplied by twelve, or three per million. The human combined rate is 0.2 multiplied by one plus 0.8 multiplied by ten, or 8.2 per million. The unadjusted aggregate makes Harborloop appear better despite worse rates within both categories.
This reversal is a property of the constructed mixture, not a claim about an actual autonomous fleet. It illustrates why the road distribution belongs in the evidence. The comparison becomes more informative if both sets of category-specific rates are weighted to a common exposure mix. Using Harborloop's ninety-ten mix, the human benchmark would be 1.9 per million rather than 8.2.
Real matching is more complicated than sorting roads into two boxes. Speed, intersection type, weather and lighting can interact. A broad county match does not guarantee identical streets or driving hours. Very fine matching, however, can leave little comparison data in each category. Analysts face a tradeoff between making populations comparable and retaining enough observations to estimate a rate meaningfully.
The report should explain this tradeoff rather than imply that one adjustment removes every difference. A matched benchmark is a reasoned approximation to a counterfactual: what would have happened if another driving population had encountered comparable exposure? Some relevant characteristics may be unavailable. A sensitivity analysis can show how the conclusion changes under plausible alternative matching choices without claiming to know the unobserved world exactly.
There is also a policy question hidden inside the matching exercise. Should the benchmark represent all drivers, newer vehicles, professional drivers or another population? Different comparisons can be useful. The choice should be stated before the reader reaches the headline. A service may outperform one benchmark and remain insufficiently studied against another, without either result being contradictory.
Claims provide another lens, not a universal crash census
A study by Di Lillo and colleagues, presented on Waymo's research site as a 2024 work, examines third-party auto liability claims across 25.3 million fully autonomous miles. It compares Waymo with human-driving benchmarks, including newer vehicles, and reports lower property-damage and bodily-injury claim rates. This is a specific insurance-based analysis involving the operator and insurance researchers, not an all-purpose count of every traffic interaction. The primary abstract was inspected for this article. The insurance-claims study
Claims are valuable because they measure consequences through a system that differs from a vehicle operator's internal incident log. But a claim is shaped by coverage, reporting, responsibility and settlement processes. An incident may generate several claims, no claim, or a claim long after the collision. A claim rate should therefore retain its identity when translated for a general audience.
Imagine Harborloop has three property-damage claims and one injury claim from the same collision. An announcement saying it had four crashes would be wrong. An announcement saying one crash means only one affected party could also be wrong. The underlying event and the financial records are connected through a many-to-one relationship that needs to be preserved during analysis.
Claim development introduces another clock. Recent events have had less time to produce complete records than older events. Comparing an immature recent cohort with a fully developed historical cohort can make the recent period look artificially quiet. A responsible analysis describes its observation cutoff and how it handles delayed reporting rather than simply labeling all records from a calendar year as equally complete.
Insurance evidence can strengthen a broader case when it points in the same direction as independently defined crash outcomes. Agreement across measures is more persuasive when the measures do not merely recycle the same reporting process. Conversely, disagreement deserves investigation. It might reflect severity, responsibility, incomplete development or differences in the populations being counted, rather than one dataset being necessarily fraudulent.
The appropriate reader response is neither to dismiss insurance data as commercial nor to treat it as automatically independent of every interested party. Ask what each organization contributed, who defined the benchmark, what data were available for checking and what the publication's actual endpoint was. A clearly bounded finding can be useful even when it does not answer the broadest question in the public debate.
Rare outcomes require patience and honest uncertainty
A fleet can accumulate substantial mileage while observing very few severe events. That is desirable for the people using the road, but it creates a statistical challenge. When the numerator is small, one additional event can change the estimated rate markedly. The point estimate should not be presented as though it were a physical constant measured without uncertainty.
Suppose a hypothetical system travels one million eligible miles with zero events of a specified type. Zero is the observed count. It does not establish that the underlying risk is exactly zero. Under a simplified Poisson model with a constant event rate and independent exposure, the probability of seeing no events when the expected count is three is about five percent. This motivates an approximate upper ninety-five-percent bound of three events per million miles in this example.
The calculation is illustrative, not a universal certification rule. Real crashes can cluster by location, weather, software version or unusual traffic conditions. The independence and constant-rate assumptions may be imperfect. The useful lesson is that an empty numerator still leaves a range of plausible risks, and that the size and relevance of the exposure determine how informative the empty numerator is.
For a nonzero count, the uncertainty also depends on the human benchmark. If the benchmark rate was estimated from a sample rather than known exactly, that uncertainty belongs in the comparison. A ratio with a narrow-looking numerator interval can still be misleading if the denominator is treated as certain without justification. Both populations contribute to the final inference.
Longer observation helps, but merely waiting does not solve every problem. If the software changes repeatedly or the service expands into different environments, accumulating all miles into one historical total may mix several risk processes. Analysts can report both the cumulative record and more recent, version-relevant experience, explaining the tradeoff between recency and statistical power.
Readers should be wary of a claim that moves its endpoint after looking at the data. If one injury definition shows a favorable difference and another does not, the difference may be informative. It should not disappear behind a single selected percentage. Clear reporting of prespecified outcomes and sensitivity analyses gives a better picture than a contest to find the most impressive reduction.
The event sequence extends beyond first contact
A crash unfolds through time. There is the approach, the first contact, the vehicle's immediate response, subsequent motion, assistance and eventual recovery. An evaluation that ends its narrative at the first impact can miss behavior that materially changes the consequences. Automated driving therefore needs evidence about the complete sequence as well as the initial collision count.
On September 30, 2024, NHTSA announced a consent order addressing incomplete Cruise crash reports, including omitted post-crash information about an October 2023 pedestrian crash. The agency described a monetary penalty and additional oversight and reporting provisions. This is a documented regulatory action concerning reporting and safety oversight; it is not a basis for inventing allegations about other companies or assuming the company's later status. NHTSA's Cruise consent-order announcement
For the fictional Harborloop assessment, a useful case record would preserve the sequence without reducing it to a single label such as minor or unavoidable. Was the vehicle already stopped? What did it do after contact? Did the situation change in a way that invalidated its prior plan? What information was available to assistance staff? These questions identify the behavior being evaluated, rather than deciding responsibility from a short clip.
A low overall crash rate does not excuse an inadequately addressed failure mechanism. If a particular response can worsen an injury, that mechanism deserves investigation even when it is rare. Conversely, one striking event does not by itself estimate the frequency of the mechanism across the fleet. Case investigation and population statistics serve different purposes and become stronger when used together.
The organization should also distinguish evidence preservation from public disclosure. Raw records may contain personal information about passengers and bystanders. Independent investigators can need access that would be inappropriate for unrestricted publication. Protecting privacy should coexist with preserving enough information for authorized review, rather than becoming an excuse to retain no auditable record.
The public summary can describe what is established, what remains uncertain and what changed after the investigation. It should avoid presenting an announced software update as proof that the underlying issue is permanently eliminated. A corrective action becomes more credible when its intended mechanism, validation scope and subsequent monitoring are explained at an appropriate level.
A safety operator changes the experiment
Testing with a trained person ready to take control can reveal problems before the system is expected to operate alone. It also changes the meaning of the resulting miles. The combined performance belongs to a system that includes the operator's attention, instructions, intervention authority and working conditions. It cannot automatically be attributed to the automated component in isolation.
The NTSB's investigation of the March 18, 2018 fatal Tempe crash identified the vehicle operator's distraction as the probable cause and described contributing organizational and oversight failures involving Uber's developmental test program. The finding is specific to that investigated crash. It demonstrates why supervision and organizational arrangements belong within safety analysis, rather than treating the presence of a human as a complete safeguard. NTSB's Tempe investigation
Suppose Harborloop's test operator intervenes before a difficult situation develops. The absence of a crash afterward does not reveal what would have happened without the intervention. A simulation may help examine a counterfactual, but its answer depends on assumptions about other road users and the system's subsequent behavior. The event should not be casually counted either as a prevented crash or as proof that no danger existed.
Intervention frequency can change for reasons unrelated to underlying driving capability. A more cautious testing policy may produce more interventions. A new route may expose the system to unfamiliar conditions. A less attentive operator might intervene less often without making the system safer. These possibilities make a simple miles-per-intervention ranking an unreliable substitute for contextual analysis.
California DMV's February 20, 2026 release describes more than nine million public-road test miles for the reporting year ending November 30, 2025. It explains that disengagement reports illuminate permit holders' operations and are not designed for comparing companies. It also separates covered testing from deployment-permit operations and other excluded activity. The release's discussion of proposed changes is historical context, not a claim here about the rules ultimately in force later. California DMV's testing report
A better testing account groups interventions by the situation, the intended testing objective and the evidence available afterward. It explains changes in policy over time. That information can guide engineering without encouraging a team to suppress interventions merely to improve a public metric. The measurement should support safe testing, not reward reluctance to use a safeguard.
Expansion is a transportability question
Harborloop now proposes service on the bridge and in the neighboring district. Its existing record remains relevant, but the inference must travel. Some capabilities may transfer well: recognizing familiar traffic signals, maintaining spacing or following ordinary lane geometry. Other aspects require additional evidence because the new environment changes the combinations of conditions the system encounters.
The expansion question can be expressed precisely: which parts of the new exposure were represented in the old data, which were represented sparsely, and which were absent? A route map can be annotated with those categories without pretending that every street is either fully proven or completely unknown. This turns a vague argument about confidence into a structured account of evidence coverage.
The new district may also change who is exposed. A hospital entrance creates different stopping and access needs from a shopping plaza. A school street has changing pedestrian activity across the day. A bridge can limit opportunities to stop outside the traffic stream. The point is not that these locations are categorically unsuitable; it is that the relevant interactions should be examined rather than averaged away.
A staged expansion can generate evidence while limiting the initial scope, but staging needs meaningful conditions. What observations would support further expansion? What observations would require restriction or additional investigation? If the criteria are invented only after a concerning event, the process can become an argument about appearances instead of an organized response to uncertainty.
Software updates create a similar transportability problem through time rather than geography. A change intended to improve one behavior might alter another. Historical data still describe what happened historically. The stronger question is how the update was evaluated against the old failure modes, newly introduced behavior and the conditions that remain within the service boundary.
A useful public explanation does not have to disclose proprietary implementation details. It can identify the kind of change, the relevant test coverage, the deployment boundary and the monitoring plan. Readers then have a way to distinguish an evidence-supported extension from an assertion that accumulated miles automatically validate every future version and location.
Safety for whom, and over which journey?
Passenger injury risk is important, but the people inside the automated vehicle are only part of the population. Other drivers, cyclists, pedestrians, emergency workers and people using mobility aids may experience different interactions. A single aggregate improvement can coexist with unresolved concerns for a smaller group or a particular street configuration.
For Harborloop, consider a service that reduces some collision types but repeatedly stops across a pedestrian crossing. A crash-only metric may not capture the resulting access problem. Equally, a delay or awkward stop should not be casually described as an injury crash. Good assessment gives these outcomes their own definitions and measures instead of stretching one label until it loses meaning.
The journey begins before the vehicle moves and continues after it arrives. Pickup location, boarding time, communication with assistance staff and the ability to exit matter to actual service use. A passenger who cannot reach a designated stopping point may be excluded from the benefit even if the driving itself performs well. Accessibility and road safety overlap but should not be collapsed into one score.
A city also faces network effects. A vehicle stopped in a narrow lane can affect buses or emergency access. Empty repositioning can add traffic. A reliable service might replace some trips that would otherwise be driven under less favorable conditions. These are empirical questions about the transport system, not consequences that can be assumed from a per-mile crash comparison alone.
A fair evaluation therefore separates at least three layers: the driving performance of an operating vehicle, the service experienced by users and nearby road users, and the broader effects of adding the service to the transport network. Evidence can be strong in one layer and incomplete in another. Keeping the layers visible prevents an attractive result from being asked to prove too much.
Distribution matters even when the overall average improves. If benefits concentrate in easily served districts while disruption concentrates elsewhere, the public decision involves more than an average reduction. Describing that distribution is not an argument against innovation. It is part of understanding the real-world outcome of an innovation deployed in shared public space.
The missing trip is part of the selection process
There is another boundary that a mileage table rarely displays: the trip that was never accepted. Suppose Harborloop declines requests when conditions exceed its declared capabilities. The completed journeys are then a selected subset of demand. Their safety record can accurately describe accepted trips while saying little about the conditions under which requests were refused.
This selection can be sensible risk management. It also means that availability should be reported alongside safety when the public question concerns transportation service. A system available only in favorable conditions may deliver a valuable benefit, but that benefit differs from replacing all journeys currently made by people. The distinction becomes important during weather disruptions, unusual events or periods when demand is concentrated in difficult locations.
Imagine two fictional services each showing a similarly low injury-crash rate. One accepts almost every eligible request within its domain; the other frequently suspends operation before difficult periods. Their observed driving rates alone cannot reveal the difference in availability. Neither service should be criticized merely for choosing a cautious boundary, but a claim about equivalent practical coverage would require additional information.
Selection can also occur after a journey begins. A trip may be interrupted, reassigned or completed through another arrangement. If the original automated segment is counted as a successful completed trip while the disruption disappears from service records, the customer experience becomes distorted. Conversely, counting every interruption as a crash would distort the safety record. Separate outcome categories make the account both fairer and more useful.
For a research comparison, analysts should identify how these decisions affect exposure. The relevant human comparison might include the same restricted conditions, or the policy analysis might explicitly compare whole services including their refusals and alternatives. Either approach can be defensible when its question is clear. Trouble begins when a restricted driving comparison is silently translated into a claim about universal transport replacement.
An informative public account would therefore show the operating boundary, important suspension conditions and the relationship between requested, accepted and completed journeys at an appropriate level of aggregation. It need not expose individual passengers. It should let communities understand which needs the service addresses and which remain outside the evidence. This helps prevent excellent performance on selected trips from being misunderstood as demonstrated performance on every trip people need to make.
Separate detection from the decision to act
A safety organization must decide what to do with a troubling signal before the final statistical answer arrives. Waiting for a severe outcome to become common enough for a narrow confidence interval would be a poor way to investigate a plausible failure mechanism. Yet reacting to every unexplained fluctuation as though it proved a systemic defect would also produce confusion.
Harborloop could distinguish routine statistical monitoring from case-based escalation. The first asks whether an outcome rate has changed beyond what the measurement process would ordinarily produce. The second asks whether a particular event reveals a credible mechanism with serious potential consequences. An unusual case may justify investigation even when the overall rate has not changed detectably.
These paths should communicate. A case investigation can identify a category that deserves closer monitoring. A rate increase can point investigators toward routes, conditions or versions that need examination. Neither path should be forced to substitute for the other. The value of a case is its explanatory detail; the value of population monitoring is its ability to describe patterns beyond one memorable event.
In an invented example, three low-speed contacts occur after a route change. The count alone does not establish causation. Investigators would need to examine exposure, event circumstances, reporting changes and whether the contacts share a mechanism. A temporary restriction might be a precaution while that work proceeds, rather than an admission that a causal conclusion is already certain.
Communication should preserve that distinction. A precautionary action can be described as precautionary. A confirmed defect can be described with the supporting evidence. A resumed service can be described in terms of the conditions under which the concern was addressed. This vocabulary helps the public follow an investigation without turning every interim step into either a confession of universal failure or a declaration of complete safety.
Finally, the organization needs authority to act on unwelcome findings. A measurement process that discovers concerns but cannot influence operations is incomplete. The public does not need access to every internal meeting to ask who owns a safety decision, how disagreements are escalated and whether evidence survives commercial pressure. Those are concrete questions about governance surrounding the vehicle, not speculative claims about anyone's motives.
Make the next claim easier to check
A credible safety publication should let a reader reconstruct its central comparison without becoming an expert in the company's software. The exposure period, operating areas, automation mode, event definitions and benchmark should be visible. Changes in data or methodology should be dated. The main result should be accompanied by uncertainty and by a plain account of where the evidence applies.
For Harborloop, the most useful release would provide a stable table of eligible mileage and outcomes, a description of exclusions, and a record of revisions. It would distinguish publicly available data from information available only to authorized reviewers. An independent reviewer should be able to trace a reported event through its classification and confirm that the matching exposure was included.
Transparency also requires restraint. Publishing a thousand poorly described fields can make scrutiny harder rather than easier. A smaller, well-documented dataset with consistent identifiers and revision history may be more valuable. The goal is not maximum volume; it is enough structured information to test the claim and understand the remaining uncertainty without exposing unnecessary personal details.
The public conversation benefits from questions that have answerable forms. Instead of asking whether driverless cars are safe in the abstract, ask whether a specified service has a lower rate of a specified harm than a specified comparison population under comparable exposure. Then ask whether the service's operating arrangements and investigation process can identify problems that a rate alone would miss.
This approach allows genuine progress to count. Favorable results should not be dismissed merely because they are bounded. Boundaries are what make a result interpretable. At the same time, a favorable historical record should not become a permission slip for every location, weather condition or software revision. The quality of the inference matters as much as the size of the mileage total.
The next street is not answered by a slogan. It is answered by a chain of evidence connecting the operation, the people exposed, the events counted and the response when something goes wrong. A driverless safety record becomes most useful when that chain can be examined, challenged and improved while preserving what the record genuinely shows.